Category Archives: Articles

Discrimination on online platforms: a call for regulation


Context

In the housing and rental market, anti-discrimination laws in the US gradually reduced discrimination through the legal system for the past two decades. However, academic scholars (Edelman, Luca & Svirsky, 2017) argue that the emergence of online platforms facilitate discrimination, as these laws do not reach smaller property owners using online platforms. Airbnb, the world largest online platform for short-term rental and housing, adopts a design choice that enables discrimination on its platform. Hosts decide whether or not to accept a guest after seeing the name and profile picture of the guest.

Methodology and experiment

In order to test whether Airbnb facilitated discrimination through its design choice, the authors (Edelman, Luca & Svirsky, 2017) conducted a field experiment across five different cities, including: Baltimore, Dallas, Los Angeles, St. Louis and Washing DC between 7 July 2015 and 30 July 2015 (see Figure 1). Originally, the experiment aimed to gather data from the top 20 cities in the US, but the experiment was halted due to Airbnb’s systems detected and blocked the automated tools used to gather the data.

Figure 1. Research scope.

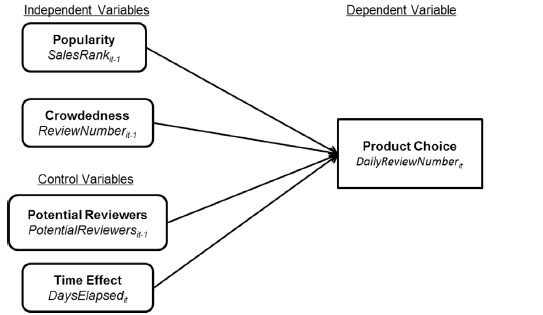
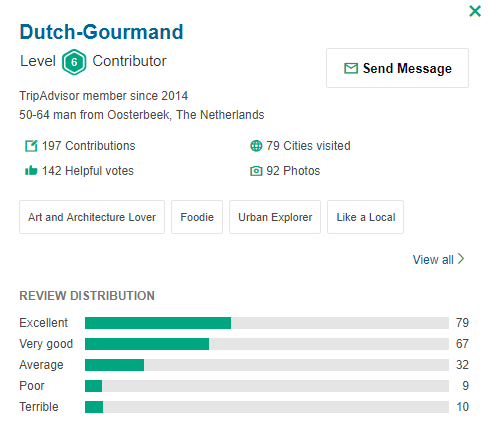
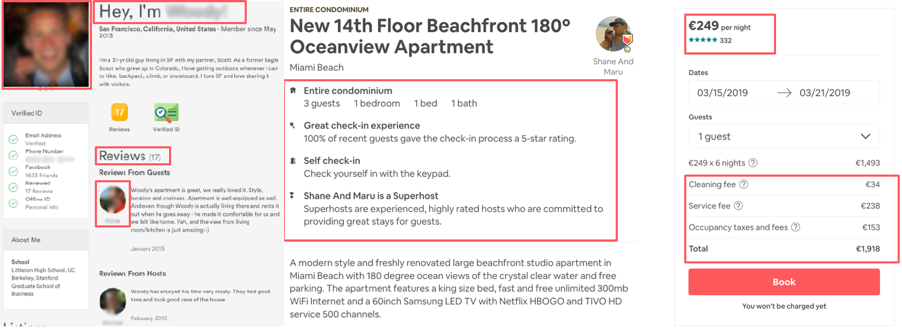
The experiment gathered a wide range of information about hosts and their listings (see Figure 2). Information of hosts include but are not limited to profile image, gender, age, number of properties listed and previous guests that visited the host. Information on listings include price, number of rooms, cancellation policy, cleaning fee, rating and whether the room was shared or not to control for interaction between the guest and the host.

Figure 2. Data collection.

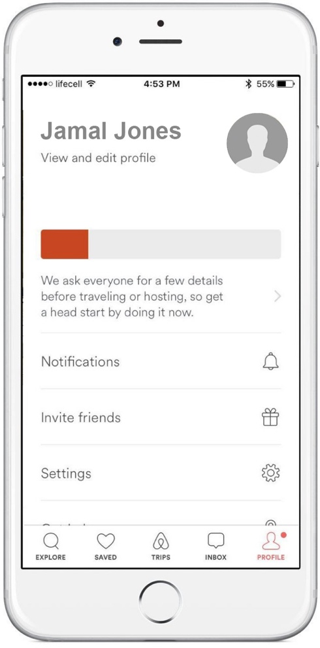
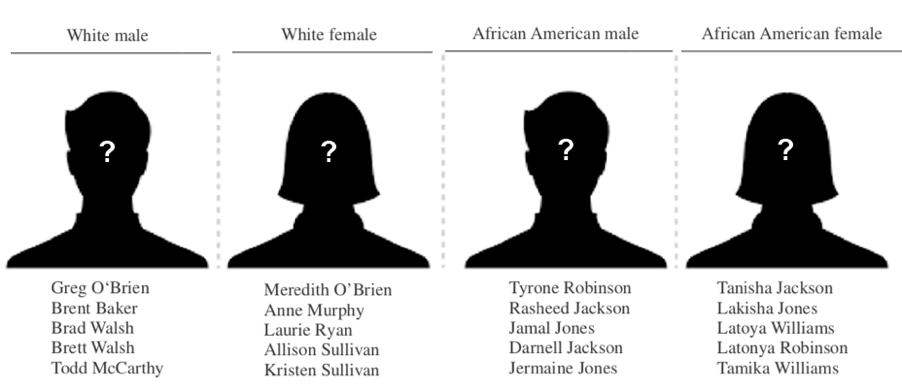
After gathering data, the experiment sent 6,400 messages with 20 Airbnb accounts. Hosts who offered multiple listings on the platform were contacted for one of their listings to prevent the host from receiving identical e-mails and to reduce the imposed burden. The accounts used to send messages are identical except for two variables: i) race and ii) gender. Race and gender were indirectly embedded in the profiles through the use of names based on Bertrand and Mullainathan (2004). Additionally, to alleviate confounds that would arise from using profile pictures, accounts did not include a profile picture. Finally, the experiment tracked the response over 30 days after the message was sent.

Results

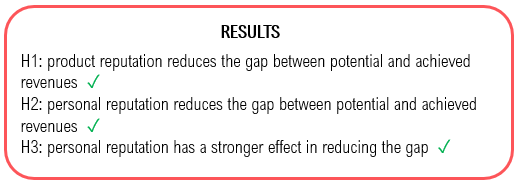
The authors found that guests with distinctive White American sounding names were accepted ±50 of the time, while guests with African American sounding names were accepted at ±42 of the time. The ±8% gap persists across characteristics of the hosts and listings as control variables. More important, the results infer that the discrimination effect occurs in differences of a simple “Yes” or “No” response and not because of intermediate response and non-response. The authors further found that the discrimination effect disappears when hosts previously accepted African American guests. Control variables including homophily concerning race, age categories, price of the listing and demographics of the vicinity are however of no significant influence on the discrimination effect. Discrimination further cause financial consequences, as host incur costs when rejecting guests causes a unit to remain unrented.

Discussion: strengths and weaknesses

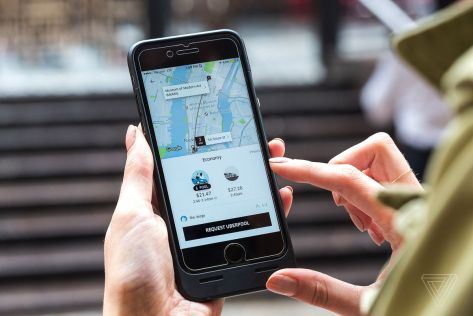
This paper provides clear evidence of the presence of discrimination in online platforms. The relevance of this paper is also strengthened by the way it emphasizes discrimination in the online channels, while in the past the focus was primarily on discrimination in offline channels. The results are consistent with other studies on discrimination in the online rental and housing market. Ge, Knittel, MacKenzie and Zoepf (2016) found a similar pattern of discrimination in peer transportation companies such as Uber and Lyft; African American passengers face longer waiting times and more frequent cancellations compared to their White-American counterparts.

The research also has a few flaws. First, the research is not able to detect the type of discrimination that occurs (e.g. statistical discrimination and taste-based discrimination) and whether discrimination is based on socioeconomic status or race that is associated with the name. Second, the paper suggests that the discrimination effect occurs when users of these platforms gain the choice to accept or to reject guests and passengers, which suggests that the problem lies in the platform’s design choice. The suggestions to alleviate discrimination by limiting design choice such as removing information of guests and passengers such as concealing names and profile photos or to eliminate the screening procedures by introducing instant book options as the only option, may harm the user experience for both (hosts and guests) sides. For hosts it is desirable if they can maintain control on who they allow to stay at their place, while for guests the platform is attractive if they can choose the place and host of their liking. When choosing to reduce discrimination by lowering the user experience for either party, online platforms run the risk of becoming less attractive than their competitors and jeopardizing their own competitiveness. Ultimately, discrimination will continue to occur on competing platforms that do not change their design in benefit of combatting discrimination and the non-discriminating company will lose its competitive edge and fail. Third, the inferences made by the paper are to a certain extent limited to the US. A recent study found that racial discrimination is more prominent in the US than in Europe (Pitner, 2018). The focus on metropolitan areas also questions whether the same effect will occur in rural areas. On the assumption that metropolitan areas are more globally connected and face higher exposure to other races, one can logically assume that metropolitan areas are more tolerant and discriminate less against other races.

Airbnb adjusted its non-discrimination policy in 2018. Hosts are no longer allowed to request a guest’s photo before accepting a booking agreement (Thinkprogress, 2018). Based on the research (Edelman, Luca and Svirsky, 2017), the adjustment will not help as hosts can still view names prior to the selection procedure. A potential solution is to increase the prevalence of reviews in the selection procedure. Cui, Li and Zhang (2016) found that encouraging credible peer-generated reviews mitigates the discrimination effect of guests with African American-sounding names on Airbnb. However, we argued that the action of one platform may not suffice as a solution to stop discrimination and call for more regulation on online platforms from authorities.

Airbnb adjusted its non-discrimination policy in 2018. Hosts are no longer allowed to request a guest’s photo before accepting a booking agreement (Thinkprogress, 2018). Based on the research (Edelman, Luca and Svirsky, 2017), the adjustment will not help as hosts can still view names prior to the selection procedure. A potential solution is to increase the prevalence of reviews in the selection procedure. Cui, Li and Zhang (2016) found that encouraging credible peer-generated reviews mitigates the discrimination effect of guests with African American-sounding names on Airbnb. However, we argued that the action of one platform may not suffice as a solution to stop discrimination and call for more regulation on online platforms from authorities.

Sources

Bertrand, M. & Mullainathan, S. (2004). “Are Emily and Greg More Employable Than Lakisha and Jamal? A Field Experiment on Labor Market Discrimination.” American Economic review 94 (4): 991–1013.

Cui, R., Li, J., & Zhang, D. (2016). Discrimination with incomplete information in the sharing economy: Evidence from field experiments on Airbnb.

Edelman, B., Luca, M., & Svirsky, D. (2017). Racial discrimination in the sharing economy: Evidence from a field experiment. American Economic Journal: Applied Economics, 9(2), 1-22.

Ge, Y., Knittel, C. R., MacKenzie, D., & Zoepf, S. (2016). Racial and gender discrimination in transportation network companies (No. w22776). National Bureau of Economic Research.

Pitner, B. H. (2018, May 17). Viewpoint: Why racism in US is worse than in Europe. Retrieved March 5, 2019, from https://www.bbc.com/news/world-us-canada-4415809

Thinkprogress. (2018). Airbnb announces booking policy change to head off outcry over persistent racial discrimination. Retrieved fromhttps://thinkprogress.org/airbnb-changes-photo-policy-combat-racial-discrimination-4f71c375553a/


The influence of the gig economy on entrepreneurial activity


TAt the moment, more than one third of the workforce in the United States works (part-time) as freelancer (Muhammed, 2019). Almost half of the freelancers over the age of 55, use supplemental gig work as a means to finance their retirement. It is expected that by 2020, almost half of the entire population will (part-time) perform gig work.

These facts are caused by the rise of the gig economy. A gig economy is an economy in which temporary, flexible jobs are common. In the gig economy, employees usually work part-time as contractors and freelancers, whilst in a classical economy employees work full-time, rarely switch jobs and often work for the same company their whole career (Kenton, 2018). During the last decade the gig economy has experienced a significant rise, caused by three major developments: First, Millennials have a different attitude towards working than the traditional workforce, as they prefer to have variety in work and a good balance between working and private life. Second, since the financial crisis of 2008, companies increasingly use gig workers to lower labor costs and to improve flexibility. Third, due to technological advances and the digitalization of the world, gig economy platforms were introduced, improving the access to gig work and workers for both firms as the labour force (Muhammed, 2018).

However, whereas the rise of the gig economy has several welfare benefits (Jennings, 2018), there are also possible downsides to it. In the paper “Can you gig it? An empirical examination of the gig economy and entrepreneurial activity.”, authors Gordon Burtch and Seth Carnahan researched a possible downside, whether the introduction of a gig economy platform in a geographical area would lead to a decrease in entrepreneurial activity.

Context & methodology

The authors used the introduction of Uber X into a specific geographical area as measure of an introduction of a gig economy platform. Uber X was chosen for two reasons: First, Uber enters the economy city-wise, meaning that for a specific area, the service might be available in one city, but might not be in another. This makes it possible to directly analyse the results of the entry of Uber X in a certain area. Second, Uber X is used instead of the (premium) Uber Black service because of the lower entry barrier and a larger network of drivers. Additionally, to measure the influence of entry barriers of the gig economy on the observed effect, the results gained by researching Uber X are compared to those of Uber Black.

The research was conducted as a natural experiment. The authors used real life examples of entries of the gig economy and measures of entrepreneurial activity. The researchers measured entrepreneurial activity by combining 2 data from 2 sources:

  • First, the US Census Current Population Survey (CPS). In this survey, self-employment is measured.
  • Second, Kickstarter campaign data was used, where the volume and size of Kickstarter campaigns were measured.

Results

The research found a significant negative correlation between the introduction of the gig economy and the entrepreneurial activity within the same geographical area. This negative correlation can be explained by the fact that gig economy platforms offers a source of income for the unemployed with a very low entry barrier, so there is no direct need for them to engage in entrepreneurial activity in order to ensure an income.

However, the research also found a significant increase in the average quality of entrepreneurial activity. According to the findings, this can be explained by the fact that people with mediocre or bad ideas that would engage in entrepreneurial activity without the entry of a gig economy platform, are now participating in that gig economy. The people that are still convinced of their own entrepreneurial qualities are pursuing their idea and don’t give it up to start driving for Uber X. These people apparently have a higher quality entrepreneurial activity, which increases the average quality of the entrepreneurial activity.

Additionally, a significant positive correlation was found between lower entry barriers of a gig economy platform and its effect on entrepreneurial activity. The research found that the introduction of Uber X (which has a low entry barrier), leads to a bigger decrease in entrepreneurial activity and a higher increase in average quality of entrepreneurial activity, as opposed to the introduction of Uber Black (which has a higher entry barrier: you have to buy a black car).

Strengths

The paper written by Burtch and Carnahan (2018) included several strengths. First, the paper included several robustness checks regarding the validity of data. By making use of multiple measures for the same phenomena, it is more likely that the correct effect was captured. Second, another strength of this paper would be the novelty of the research, as the paper is the first to examine the supply side of the gig economy. By researching novel subjects, the added-value to literature of this particular research area is higher. Third, as the paper makes use of two different data sources to measure entrepreneurial activity, the reliability of the data used in this paper is higher.

Weaknesses

Besides several strengths, the research done by Burtch and Carnahan (2018)  has several weaknesses as well. First, a weakness of this paper would be the low generalizability of the sample. The research is solely performed in the United States, which is a country with low unemployment benefits. According to Cowling and Bygrave (2002) has a significant correlation with entrepreneurial activity. Having only performed research within the United States, the generalizability of the results is lower, which reduces the findings’ value.

Second, the paper’s assumption that Uber drivers would otherwise engage in entrepreneurial activity, might be too big of an assumption. As Uber offers low-skilled jobs, its drivers might not be the people who would otherwise engage in entrepreneurial activity. People might even start driving Uber X to make some money, but use the flexibility in planning to actually start a business next to driving for Uber X. Moreover, the paper assumes that the entry and timing of Uber X is exogenous with respect to entrepreneurial activity. These assumptions both deteriorate the research quality, but proved necessary to perform the research.

Lastly, the paper contains data issues. For the first time, the volume of Kickstarter campaigns was used as a (partial) measure for entrepreneurial activity. Kickstarter campaigns may be run multiple times, which implies that the quality of the data might be lower than expected. Another reason why the data from kickstarter might not be generalizable, is that it was obtained during a period of economic recession, during which unemployment rates are higher than normal, which could mean that the impact might be different than it would be during a ‘normal’ period of time.

Implications

The paper proves worthy both in research and in practice. For academics, this paper proves valuable as it is one of the pioneers in researching the supply side of the gig economy. On top of that, the researchers also pioneered in using kickstarter as a measure for entrepreneurial activity, despite its limitations. For policymakers debating about the legality of gig economy platforms as Uber, this paper could provide relevant insights for crafting legislation around gig economy platforms.

In many countries Uber faces legal problems.

Conclusion

The paper provides new information towards research about the gig economy as it offers insights on the supply side, which was rarely researched previously. The insights of this paper are relevant but should be taken cautiously however, as there are multiple notable concerns towards the validity, despite the efforts of the authors to ensure the quality.

References

Burtch, G., Carnahan, S., & Greenwood, B. N. (2018). Can you gig it? An empirical examination of the gig economy and entrepreneurial activity. Management Science, 64(12), 5497-5520.

Cowling, M., & Bygrave, W. D. (2002). Entrepreneurship and unemployment: relationships between unemployment and entrepreneurship in 37 nations participating in the Global Entrepreneurship Monitor (GEM) 2002. In Babson College, Babson Kauffman Entrepreneurship Research Conference (BKERC) (Vol. 2006).

Gooch, K. (2018). More Americans turn to crowdfunding for medical bills: 6 things to know. Many Americans struggle to afford their medical bills and are increasingly turning to crowdfunding for support, reports Yahoo Finance. Retrieved from https://www.beckershospitalreview.com/finance/more-americans-turn-to-crowdfunding-for-medical-bills-6-things-to-know.html

Jennings, M. (2018). 7 Reasons Why the gig economy is a Net Positive. Retrieved from https://www.entrepreneur.com/article/310685

Kenton, W. (2018). gig economy. Retrieved from https://www.investopedia.com/terms/g/gig-economy.asp

Muhammed, A. (2018). 4 Reasons Why The gig economy Will Only Keep Growing In Numbers. Retrieved from https://www.forbes.com/sites/abdullahimuhammed/2018/06/28/4-reasons-why-the-gig-economy-will-only-keep-growing-in-numbers/#6344d33e11eb

The Rise of the Sharing Economy: Estimating the Impact of Airbnb on the Hotel Industry


Paper discussed:
Zervas, G., Proserpio, D., & Byers, J. W. (2017). The rise of the sharing economy: Estimating the impact of Airbnb on the hotel industry. Journal of marketing research, 54(5), 687-705

1. Introduction

Peer-to-peer markets, also known as the sharing economy, has enabled people to collaboratively make use of underutilized inventory through fee-based sharing. The rapid growth of peer-to-peer platforms has arguably been enabled by two key factors: technology innovations and supply-side flexibility. This study analyzes Airbnb’s entry into the state of Texas and quantifies the impact on the Texas hotel industry between 2008 and 2014. The paper contributes to the growing literature on multi-sided platform competition, as Airbnb is an example of a two-sided platform. Besides, the work contributes to the existing literature by focusing on the impact of external shocks on the tourism and the hospitality industry. The researchers expect that some stays on the Airbnb platform will substitute certain hotel accommodations. This can significantly affect the hotel revenue. Though, the authors note that the impact differs per geographic region, hotel market segment and season.

2. Method

In order to quantify the extent to which Airbnb’s entry has negatively affected the hotel room revenue, the researchers gathered data from various sources. The Airbnb platform was the main source of data for this study. Additionally, the monthly room revenue from 3,000 hotels in Texas together with several other datasets were included in this study to account for the information on control variables and in order to conduct robustness checks.

After collecting the necessary data, a difference in differences (DD) empirical strategy is conducted to identify the causal impact of Airbnb on hotel revenue. This strategy identifies the Airbnb treatment effect by comparing differences in revenue for hotels affected by Airbnb before and after Airbnb’s entry with a baseline of differences in revenue for hotels that were not affected by Airbnb in the same period. To perform the analysis, they regress against two measures of Airbnb supply, namely a cumulative measure of all Airbnb listings and an instantaneous measure that defines supply as those Airbnb listings active within a short period. In all their specifications, they included a set of control variables that vary over time. For example, control variables such as population, wages, unemployment, total hotel room supply, airport passengers counts and TripAdvisor ratings were taken into account for each hotel as a proxy for quality. Also, they included city-specific trends and city-month dummies to account for seasonal differences in demand across the different markets. Finally, they have conducted several robustness check in order to support the causal interpretation of the estimates.

3. Findings

The authors found that, in Texas, each additional 10% increase in the size of the Airbnb market resulted in a .39% decrease in hotel room revenue. These effects are primarily driven by Austin, where Airbnb inventory has grown extremely rapidly over the last years, resulting in an estimated revenue impact of 8%-10% for the most vulnerable hotels in Austin. Accordingly, the researchers found that the impact of Airbnb is bigger on cheaper hotels in comparison with expensive hotels. The impact of Airbnb also falls disproportionately on hotels lacking conference facilities. Another finding is related to type of hotel; chain hotels tend to be less affected by Airbnb than independent hotels. This can be explained by the fact that chain hotels have a larger marketing budget and can thus benefit from their stronger brand identity. To conclude, the research showed that Airbnb is flexible in terms of their ability to flexibly scale instantaneous supply in response to seasonal demand, whereas hotels lack the flexibility. This has significantly limited hotels’ pricing power during periods of peak demand.

4. Strengths & Weaknesses

The main limitation of this study is related to the representativeness of this study since the AirBnb effect on the hotel industry is only studied in Texas. The generalizability of the findings should be taken into account considering the volatility of the housing market and the sensitivity of the hotel industry towards economic differences and other dynamics influencing supply and demand for accommodation. Though, the research uses a diverse set of data sources and controls for various exogenous variables (e.g. population, wages, unemployment and total hotel room supply). The authors point a similar limitation In addition, the study investigates multiple cities in a large state and the data is collected in a time period of 6 years (2008-2014). On the one hand, the long time period adds to the level of reliability and consistency of the research. On the other hand, the timing of the data period (2008-2014) yields a point of discussion since it investigated the vacation rental platform before the explosion of peer-2-peer networks happened.

Another limitation of this paper is related to the analyzed properties, the authors only consider AirBnb as the main peer-to-peer platform, whereas other vacation rental platforms such as HomeAway and VRBO do gain traction as well and might influence the negative on the hotel industry as studied. Also, the authors of the research add that only short run implications are considered by including only two metrics;  price and occupancy rate. A longer time scale is not included, this reasons that the authors did not include the longer time scale is arguable. Further research can take the findings of this research as a starting point to study possible ways to respond to peer-to-peer platforms such as AirBnb. For example, alterations of investment schedules can be analyzed or effect of government regulations can be taken into account.

Overall the paper considers the short-term effect of the peer-to-peer platform AirBnb on the revenue stream of the hotel industry in Texas. Strengths of this paper are mainly related to the comprehensive investigation of the AirBnb platform, economy and housing market in Texas including controlling for exogenous factors such as airport passengers counts and TripAdvisor ratings. Not to mention the wide time span of six years (2008-2014). All strengths of this research considered, generalizability is a main concern of the findings. Though, the research takes a first step in quantifying the effect on society by analyzing AirBnb which contributes to the recent development of peer-to-peer networks in the raising sharing economy. By quantifying the effect through including several reliable data sources (e.g. platform itself and the monthly room revenue from 3,000 hotels in Texas), control variables and other exogenous factors, the study does provide practical relevance in terms of showing the exact effect in percentages and how the researched variables account for differences in the effect. The study is therefore relevant for society and other countries as well as governmental bodies, consumers and the hotel industry itself.

References

Zervas, G., Proserpio, D., & Byers, J. W. (2017). The rise of the sharing economy: Estimating the impact of Airbnb on the hotel industry. Journal of marketing research, 54(5), 687-705


Just say ‘go’ to your kids, with ‘Gokid’ ridesharing..


Imagine yourself rushing home after a busy workday, hoping you do not hit traffic, so you can pick up your kids from school just in time to shuttle them back and forth to sports, friends or other activities, and finally drop them off at home. For parents it often feels like a full-time job besides there existing job. Although, our transportation industry has changed substantially in the past few years with the emergence of major peer-to-peer car services such as Uber or Lyft, there is still no easy way to organize kid’s carpools today.

Ridesharing with GoKid

The perfect solution: GoKid. This New York based start-up founded in 2010, meets this growing need for better children’s transportation through building a mobile application that enables parents to share carpooling responsibilities with a network of friends, families and neighbours they know and trust. An app that not only saves time and money for parents, but also reduces traffic congestion. GoKid is known for its free ride set-up whereas other ridesharing services for kids, like Zum or HopSkipDrive, charges per ride and use paid drivers. More importantly, however, the most fascinating thing about GoKid is the way they actively involve parents and caregivers to build a carpool community based on trust (GoKid, 2018).

How does it work for parents and schools?

GoKid is a mobile application and software as a service (SaaS) solution that serves both parents and schools. Differently from ridesharing services, like HopSkipDrive, GoKid works with an invitation-based voluntary system in which parents or caregivers are the drivers instead of paid drivers. Families can sign-up for GoKid within four basic steps: setting up a family account including parents, children and residential details; crating a carpool with location and time specifications; inviting other families or caregivers to join the carpool and lastly, sign up to drive carpools that suit your schedule best (Waite, 2018). In this way, families do not only save time, but they also save a minimum of 60% in transportation costs (Clark, 2018). However, a big barrier for parents to set up school carpools is that they often do not know who in their child’s class lives nearby or has the same agenda (GoKid, 2018). GoKid overcomes this barrier by providing a secure portal ‘GoKid Connect’, in which data is shared by schools or (sport) teams, to enable parents to reach out to other families who live in the neighbourhood and have kids in the same class (Dhakappa, 2018). Hence, GoKid offers a business-to-business solution that solves the biggest issue with school transportation (GoKid, 2018).

Business Model

GoKid uses a multi-sided market model. On the direct to customer side, there is a freemium model which gives parents free access to features such as, setting up carpools and have an optimized route for carpooling which avoids traffic. The premium version, GoKid Pro, includes additional features such as the ability to sync the carpools with the parents’ calendars and in-app messaging with other families in the carpool group for a monthly or annual subscription. On the business to business side, schools and organizations use the GoKid Connect for an annual subscription fee.

GoKid employs a consumer co-production network, as it shifts the power of value creation to stakeholders in two different ways, so that consumers and schools or teams create most of the value. On one side, parents of caregivers directly produce value for other families by initiating to share rides with families of whom the kids need to go to the same destination (Dellaert, 2018), by acting as service providers. However, families that consume the carpool service by letting other parents or caregivers drive their kids, need to act like service providers as well when it is their turn to ride. In this way, the platform enables parents to reclaim valuable time and save transportation costs. On the other side, schools or teams provide value to consumers (i.e. families) and themselves by sharing their databases with GoKid which helps families to connect with each other and set up carpool groups. Also, they create value for themselves as the shared-ride solution helps them to retain families that otherwise might have chosen to enrol in another school and it reduces the number of absent children (GoKid, 2018).

Moreover, GoKid’s value creation goes even further through building communities as the business model highly depends on trust. First, Gokid tries to create member attachment by featuring in-app messaging which allows parents to easily contact each other and establish trusted relationships. Interpersonal communication stimulates bond-based attachment and eventually attachment to GoKid’s online community (Ren et al., 2012). Furthermore, bond-based attachment is stimulated as carpooling allows parents and children to have one-on-one interactions with each other resulting in a valuable opportunity for socialization and development of friendships (GoKid, 2018). Member attachment is very important for GoKid’s online community, as the platform strongly depends on network affects. Hence, carpool creators (e.g. parents or caregivers) need to be highly active participants in the carpool themselves to produce value and receive value in return, as GoKid’s premise is inherently viral. The more families participate within a carpool group and initiate to drive their kids and other’s kids to a certain destination (i.e. producers), the more valuable the network is for other families to join the platform, because more rides can be shared reducing the total number of rides each family have to make for their kids (i.e. consumers).

Efficiency of the model

There is growing demand from working parent for safe and efficient shared model child transportation, with little time for complex ride schedules. GoKid’s current system is not only beneficial for parents or caregivers and school in multiple way, but for the whole society as well. On the one hand, families benefit as they save time, due using GoKid for the coordination of carpooling schedules and carpooling, and money due reduced transportation costs. Moreover, the app solves an information gap for families by sharing data collected from schools and teams. On the other hand, schools benefit as GoKid reduces the number of absent children with 30% and makes it harder for parents to switch their children to another school due to the community they have built. The society benefits because there are less vehicles on the road decreasing traffic congestion, and consequently gas pollution which positively effects air- and water quality (Clark, 2016). Finally, GoKid itself benefits from their premium subscriptions, the collection of data (e.g. driver routes, traffic congestion) and their positive contribution to the environment which strengths their image (Waite, 2018).

GoKid has clear internal rules and regulations to ensure the safety of kids, such as behavioural guidelines and rules regarding licenses and car seats (GoKid Terms, 2018). Unlike HopSkipDrive, users of the service are fully responsible for all liabilities relating thereto. Because carpool groups consist of multiple families that know and trust each other, there are no legal measures that drivers most go through assuming that everyone wants their kids to be safe. However, to guarantee this safety for the children, GoKid requires that the parent driving each carpool also has their own kids in the car. Besides that, drivers must abide the traffic laws that apply the country in which they drive (Lemcke, 2016).  

What brings the future?

GoKid is planning to expand its product offerings by integrating their technology into vehicles through partnerships with Bosch and InMotion (Dhakappa, 2018). In addition, the company aims to work with more partners to allow users to sync their schedules from other apps in order to create a seamless carpool set up from existing events or corporates. Koslowski, vice president of the research firm Gartner, Inc., believes that approximately 20% of the vehicles in urban areas will be shared-use vehicles by 2025 (GoKid Team, 2018). This leaves high potential for GoKid to grow their user base and revenue streams in other countries, as GoKid is thinking big and thinking global (GoKid, 2018).

References

Clark, A. 2018. Efficient school transportation with GoKid to manage traffic congestion. [Online] Available at: https://www.gokid.mobi/efficient-school-transportation-with-gokid-to-manage-traffic-congestion/

Dellaert, B.G.C. 2018. The consumer production journey: marketing to consumers as co-producers in the sharing economy. Journal of the Academy of Marketing Science, forthcoming, 1-17.

Dickey, M. R., 2019. Zūm, a ridesharing service f[or kids, raises $40 million. [Online] Available at: https://techcrunch.com/2019/02/28/zum-a-ridesharing-service-for-kids-raises-40-million/

Dhakappa, B. 2018. GoKid – Making Kids Carpooling Easier. [Online] Avaiable at: https://techweek.com/gokid-newyork-kid-carpool/

GoKid Team., 2018. Is Car sharing the future? [Online] Available at: https://www.gokid.mobi/is-car-sharing-the-future/

GoKid Team., 2018. How GoKid compares to child driving services. [Online] Available at: https://www.gokid.mobi/how-gokid-compares-to-child-driving-services/  

GoKid Team., 2018. Best child transportation tips for busy parents in Chicago. [Online] Available at: https://www.gokid.mobi/best-child-transportation-tips-for-busy-parents-in-chicago/

GoKid., 2018. GoKid Carpool Safety. [Online] Available at: https://www.gokid.mobi/gokid-carpool-safety/

Lemcke, S., 2016. GoKid Carpooling101 – Carpoolingetiquette. [Online] Available at: https://www.gokid.mobi/gokid-carpooling101-carpooletiquette/

Ren, Y., Harper, F.M., Drenner, S., Terveen, L., Kiesler, S., Riedl, J. and Kraut, R.E., 2012. Building member attachment in online communities: Applying theories of group identity and interpersonal bonds. MIS Quarterly, pp.841-864.

Waite, M. 2018. How this app is providing community mobility solutions and personal parenting options. [Online] Available at: https://www.greenbiz.com/article/how-app-providing-community-mobility-solutions-and-personal-parenting-options

battle of the food waste: ‘Too good to go’


An exploration of the different stakeholders and business model of famous food waste reduction app ‘Too Good To Go’

Ever walked into your local student dominated Albert Heijn and seen multiple fruits, vegetables and even full-made meals having a reduction sticker on them? Ever wondered what happened to these products if they don’t get sold by the end of the day? Well, I can burst your bubble, over 2.5 million tons of such products are thrown away annually in the Netherlands only (Toogoodtogo.nl/aboutus, 2019). As can be seen in the picture below (figure 1), households are the biggest spillers, followed by manufacturers, hospitality and retailers. This is very unfortunate because these products are foods that are on, or past, their expiration date, but are absolutely still fit for consumption. It would therefore be a pity for them to end up in the bin.

Figure 1: Distribution of spillage across the value chain (mst.dk/toogoodtogo, p.5)

Too good to go: the business model and market

In regards to the large food spillage annually, that adds up to one third of all food being produced going to waste, the app Too Good To Go was brought into life (toogoodtogo.nl/aboutus, 2019). Established in 2015 in Denmark, Chris Wilson and Jamie Crummie created the app in order to  reduce food spillage and CO2 production in Denmark. By having a 20% subscription rate of Danish citizens, Too Good to Go felt secure enough to spread their innovative idea to non-European countries and other European countries like the Netherlands (Toogoodtogo.nl, 2019). This proved to be increasingly successful as the app is based on a very simple, though effectively smart business model.

Since its launch in the Netherlands in January 2018, over 200.000 meals were saved through Too Good To Go (Boskma, 2019; Figure 2). When comparing the Dutch market to the Danish one, several differences can be found. Due to the large amount of plastic packed vegetables for example, in all shapes, mixes and sizes, in the Netherlands, products are barely preservable (Keyzer, 2019). In the Danish market, they are presented in crates. Therefore, ease of use stands central to the Dutch consumer market. Moreover, in the Danish market many initiatives already existed that battled food waste, many of them being subsidized by the government. In the Netherlands, on the contrary, little initiatives are up and running, besides Kromkommer and Instock, who never made the so called ‘frontpage’ due to little consumer interest (Keyzer, 2019).

So, back to the app, how does it function and what principles is it based on (Figure 3)? Too good to go makes sure that local horeca and retail owners are connected to local citizens, who are up for purchasing past-date food (Posthumus, 2019). Local shops can every day indicate whether they have left-over food and place it on the Too Good To Go platform. Consumers in return, can purchase these products in a ‘Magic Box’. On beforehand, they do not know what will be in the actual box (Boskma, 2019). By following this business model, consumers are helped by getting high quality food for a reduced price, whereas local shops receive more revenue (Loritz, 2019).

Figure 2: Screenshot of the Dutch Too Good To Go Instagram account disclosing that 200.000 meals were saved

Figure 3: Outlook of the app design

Value creation and the three perspectives

When elaborating on the business model we see that the value proposition for the consumer, or end user, is based on the previously spoken about reduced price. Here, the final selling price, which is between €3 and €5,  is based on one third of the original price. Another value proposition, which will mainly speak to environmentally conscious consumers, is that by purchasing a Magic Box a certain amount of CO2 is reduced (Boska, 2019). Therefore, environmental conscious, and even non-environmental conscious consumers are targeted and persuaded into buying high quality food against a reduced price. Overall, we see that the largest consumer base is presented by millenials, who are overall more aware and involved with the environment (Smith & Brower, 2012). As Too Good to Go connects with their consumers via the app and social media to stay in contact and provide a communication stream, they do well as again, millenials are the most frequent users of social media (Statista.com, 2019; Figure 4).

However, not only the value propositions for the end consumer are very clear, also the suppliers (the restaurants, local bakeries and so on) profit from their Too Good To Go presence. Products that would be disregarded to the bin, now are given a new life. Therefore, money that is invested in stock purchase or the production process is now being turned in revenue by reselling via Too Good To Go. Moreover, reducing food spillage is often on the bottom of the priority list (Keyzer, 2019). However, in many cases the wish to reduce waste is there but setting up a seperate incentive to resell stock is very money and time intensive. Too Good To Go gives a helping hand here. The app and its functions are very much adaptable in the business operations and easy in use (Keyzer, 2019). Besides gaining more revenue, compared to not using Too Good To Go, Too Good To Go can be a platform for end users to find and meet suppliers. Therefore, Too Good To Go functions as a marketing platform for suppliers that by being part of the app, can attract new consumers (Wang, Kim & Malthouse, 2016).

Lastly, we may view the platform perspective of Too Good To Go. The value creation process of Too Good To Go as a platform is mainly based on the making profits and reducing food waste. By its large customer base, the latter is no concern anymore. There is however room for growth and To Good To Go suspects to be self-sustainable in a few years. The first value proposition however, is not being met yet. Too Good To Go is still in its developmental phase in the Netherlands gaining more users by the day (Posthumus, 2019). At this very moment the cost structure is based on a percentage of the revenue each supplier makes, and differ across companies (Keyzer, 2019). By gaining more customers, and at the same time enlisting more suppliers to the app, Too Good To Go will become profitable on the longer term.

Figure 4: Distribution of Instagram users categorized by age groups (Statista.com, 2019)

Efficiency of the model

As can be stated, the model proves to be very efficient so far. The success of Too Good To Go lies mainly in the price reduction of the food that is being offered. The prices range from €3 to €5 respectively, leaving customers to buy quicker. From day one, Too Good To Go had little to no marketing budget but mainly grew by their online presence and positive WOM (Keyzer, 2019). Moreover, the app offers easy use, indicates distance from your current location to the supplier, and leaves you saving favourite restaurants to keep up to date to the latest offers. Also, the app offers not only restaurant food, you are also able to purchase your groceries from the supermarket or local bakery (Posthumus, 2019). Overall this seems very favourable. However, the efficiency of Too Good To Go’s model suffered some damage in the past. Before, no payment with IDeal was offered. Only payment with PayPal or creditcard was possible. As a relatively low percentage of Dutch consumers do have PayPal accounts or creditcards, some potential customers were not able to purchase from the platform. Too Good To Go fortunately made payment via iDeal possible in December 2018 (Keyzer, 2019). Another flaw in the efficiency of the model is the coverage / spread as well as the restaurant offerings on the platform. At this moment, Too Good To Go is very much present in cities, but lack presence in more rural areas. Also, it is very hard to keep up with the demand of the customers (Keyzer, 2019). Too Good To Go is rapidly growing and needs to close new deals with suppliers every day to stay up with the demand. This will prove to be tough, but by the success that Too Good To Go had so far, I expect that it will become as successful as in the Danish market.

References

Boskma, I. (2019). Too Good To Go gaat samenwerken met Albert Heijn en Jumbo. Retrieved from https://www.dutchcowboys.nl/nieuws/too-good-to-go-gaat-samenwerken-met-albert-heijn-en-jumbo

Keyzer, T. (2019). Deze app tegen voedselverspilling trok binnen 1 jaar 300 duizend gebruikers. Retrieved from https://www.businessinsider.nl/too-good-to-go-joost-rietveld/

Loritz, M. (2019). Copenhagen-based app Too Good To Go raises a further €6 million to eliminate food waste | EU-Startups. Retrieved from https://www.eu-startups.com/2019/02/copenhagen-based-app-too-good-to-go-raises-a-further-e6-million-to-eliminate-food-waste/

mst.dk (2019). Retrieved from https://mst.dk/media/91627/stian-olesen-too_good_to_go.pdf

Posthuma, W. (2019). Too Good To Go: ‘200.000 maaltijden gered van de vuilnisbak’. Retrieved from https://www.missethoreca.nl/restaurant/nieuws/2019/01/too-good-to-go-200-000-maaltijden-gered-van-de-vuilnisbak-101315444?vakmedianet-approve-cookies=1&_ga=2.235803906.261607741.1552232949-1156442447.1552232949

Smith, K., & Brower, T. (2012). Longitudinal study of green marketing strategies that influence Millennials. Journal Of Strategic Marketing, 20(6), 535-551. doi: 10.1080/0965254x.2012.711345

Statista.com (2019). Global Instagram user age & gender distribution 2019 | Statistic. Retrieved from https://www.statista.com/statistics/248769/age-distribution-of-worldwide-instagram-users/

Too Good To Go (2019). Retrieved from https://toogoodtogo.nl/nl

Wang, B., Kim, S., & Malthouse, E. (2016). Branded apps and mobile platforms as new tools for advertising, 2, 1-39.

The rise and fall of carpooling.com


Today’s sharing economy is characterized by the co-production of consumers, which offers a lot of new opportunities to companies that can exploit new ways of generating revenue (Dellaert, 2018). One of the promising trends that can be seen in our sharing economy is the increasing popularity of ridesharing practices (Statista, n.d.; McKinsey, 2017). More and more drivers decide to fill up their empty car seats and offer these spots on online ridesharing platforms to a growing number of riders. One of the early companies that successfully established its business model around ridesharing practices is Carpooling.com. Moreover, this company was in 2012 world’s largest ridesharing provider. However, only three years later Carpooling.com seized to exist and was acquired and folded into its competitor BlaBlaCar.

So… what went wrong? How could such a large and powerful platform go down so quickly?

Timeline

Carpooling.com was created in 2001 by three innovative MBA students in Munich (Kite-Powell, 2012). These students captured the opportunity of an unmet need that existed in the automobile market. Moreover, gas prices were rising, congestion was worsening, and the majority of car owners was mostly driving in their car alone. To address these factors, Carpooling.com was launched with the idea to offer a platform through which drivers and riders are connected. Drivers could post their empty seats online and riders could book these seats. Consequently, drivers were driving less times by themselves, resources were shared, and an impressive impact was made on the CO2 emission (Jalali et al., 2017). For example, in 2011 the platform service saved drivers 27 million gallons of gas and prevented a CO2 emission of  205,000 tons (Kite-Powell, 2012).

In 2007, the platform was the largest carpooling platform of Germany. At this moment in time, the main revenue stream of the company came from advertising and key partnerships with associations or companies that were involved into the car industry (e.g. ADAC, the German automobile club). In 2009, the company received a capital injection and expanded its scope to other European countries. The company continued to grow due to the economic crisis, the improvement of mobile technology, and the emerging trend of the sharing economy. All of these factors increased the popularity of ridesharing and consequently led Carpooling.com to become the world’s largest provider of car-sharing services in 2012. In the following years, the company started some partnerships with the focus on sustainability and received another capital injection for its expansion towards the United States.

This sounds like a story similar to companies such as Facebook or Amazon that usually end with the facts on how great the company is doing at the moment (Haucap & Heimeshoff, 2013). However, in 2015, Carpooling.com got sold to its competitor BlaBlaCar, only three years after establishing its position as global leader. The question at hand is what mistakes the company made in order for it to go down so quickly; the answer can be found in some destructive adjustments in its business model.

Business model

Carpooling.com offered a platform at which drivers and riders were connected. Riders could choose which driver they wanted to join and could select from a variety of features, such as car size, comfort, and price. After each ride, drivers and riders could rate each other, building up a profiles of two-way reviews. According to Shen et al. (2015), a high rating results in increased attention and a better reputation; consequently, drivers and riders with a higher rating were more likely to be accepted for a certain ride. Furthermore, the users could use an in-app service that offered rides by public transport as a final step to get to their destination.

Revenue was generated through two different streams (Boyd, 2012). First of all, the company earned money by personalizing its software for bigger companies that wanted to use the service for their employees. The second income stream came from advertising, which was by far the largest revenue generator. Moreover, due to the large two-sided network effects that Carpooling.com was enjoying, the company’s user base kept growing and its website, on which ads were shown, was frequently visited by high numbers of users (Parker et al., 2005).

In 2013, Carpooling.com introduced a new revenue model in which a third income stream was added (Täuscher & Kietzmann, 2017). Moreover, the company became ‘greedy’ and started to charge its users a small fee per ride; this changed everything. Previously, payments were done in person after the ride. However, to be able to collect money from its users, the company now insisted that all users register themselves and pay the price of the ride up front and online. This led to a decrease in the perceived ease of use of the platform, because users had to put more effort in to book or sell their rides (Venkatesh & Bala, 2008). Consequently, a lot of clamor emerged on the platform and users heavily complained about the fact that a previously free service suddenly had been given a price label.

According to King et al. (2014), the importance of electronic word-of-mouth cannot be underestimated. Moreover, as a consequence of the dispersion of negative online posts about the company and the decreased user satisfaction, an initially gradient downstream of users started to appear who switched over to alternative carpooling sites. This downstream became increased rapidly, due to a loss of two-sided network effects (Parker et al., 2005). The less drivers that were active on the platform, the less riders could use carpooling services and vice versa. Consequently, Carpooling.com lost a large share of its users which weakened the company and made it vulnerable to the takeover from its main competitor BlaBlaCar.

Lessons learned

The case of Carpooling.com is a school example of having the wrong priorities and underestimating the power electronic word-of-mouth in our sharing economy. Consumer co-production offers many opportunities to companies and the ones that manage to exploit this successfully, receive high customer satisfaction and loyalty, and can enjoy terrific profits (Edvardsson et al., 2000). However, companies these days should prioritize their business focus on their customer, because customers have a great, potentially devastating, influence on the life expectancy of a firm.

References:

Boyd, C. (2012). Carpooling the German way. PRI’s the World. Available from https://www.pri.org/stories/2012-02-08/carpooling-german-way

Dellaert, B.G.C. (2018). The consumer production journey: Marketing to consumers as co-producers in the sharing economy. Journal of the Academy of Marketing Science, pp. 1-17. Available from https://doi.org/10.1007/s11747-018-0607-4

Edvardsson, B., Johnson, M.D., Gustafsson, A. & Strandvik, T. (2000). The effects of satisfaction and loyalty on profits and growth: Products versus services. Total Quality Management, Vol. 11, Issue: 7, pp. 917-927. Available from https://www.tandfonline.com/doi/abs/10.1080/09544120050135461?casa_token=KmKFB3GtqnIAAAAA:BaQrIvERmOA1eY_EbNy5RkWw1f2UdUHgs684MmWGzQigOp_GrTIB5M4TT_cdmm-O5LDMhjkOEAX6

Haucap, J. & Heimeshoff, U. (2014). Google, Facebook, Amazon, eBay: Is the Internet driving competition or market monopolization? International Economics and Economic Policy, Vol. 11, Issue: 1-2, pp. 49-61. Available from https://link.springer.com/article/10.1007/s10368-013-0247-6

Jalali, R., Koohi-Fayegh, S., El-Khatib, K., Hoornweg, D. & Li, H. (2017). Investigating the potential of ridesharing to reduce vehicle emissions. Urban Planning, Vol. 2, Issue: 2, pp. 26-40. Available from https://www.cogitatiopress.com/urbanplanning/article/view/937/937

Käuscher, K. & Kietzmann, J. (2017). Learning from failures in the sharing economy. Management Information Systems Quarterly Executive, Vol. 16, Issue: 4, pp. 253-263. Available from https://www.researchgate.net/profile/Karl_Taeuscher/publication/321747580_Learning_from_Failures_in_the_Sharing_Economy/links/5a2f8f04aca2726d0bd6eafc/Learning-from-Failures-in-the-Sharing-Economy.pdf

King, R.A., Racherla, P. & Bush, V.D. (2014). What we know and don’t know about online word-of-mouth: A review and synthesis of the literature. Journal of Interactive Marketing, Vol. 28, pp. 167-183. Available from https://www.sciencedirect.com/science/article/pii/S1094996814000139

Kite-Powell, J. (2012). Germany’s Carpooling.com proves rideshare works. Forbes. Available from https://www.forbes.com/sites/jenniferhicks/2012/06/08/germanys-carpooling-com-proves-rideshare-works/#50a130d358d2

McKinsey (2017). Cracks in the ridesharing market – and how to fill them. McKinsey Quarterly. Available from https://www.mckinsey.com/industries/automotive-and-assembly/our-insights/cracks-in-the-ridesharing-market-and-how-to-fill-them

Parker, G.G. & Van Alstyne, M.W. (2005). Two-sided network effects: A theory of information product design. Management Science, Vol. 51, Issue: 10, pp. 1449-1592. Available from https://pubsonline.informs.org/doi/abs/10.1287/mnsc.1050.0400

Shen, W., Hu, Y.J. & Ulmer, J.R. (2015). Competing for attention: An emperical study of online reviewers’ strategic behavior. MIS Quarterly, Vol. 39, Issue: 3, pp. 683-696. Available from https://www.researchgate.net/publication/267250558_Competing_for_Attention_An_Empirical_Study_of_Online_Reviewers’_Strategic_Behavior

Statista (n.d.). Ridesharing services in the U.S. – Statistics & Facts. Webstite Statista. Retrieved at 11-03-2019 from https://www.statista.com/topics/4610/ridesharing-services-in-the-us/

Venkatesh, V. & Bala, H. (2008). Technology acceptance model 3 and a research agenda on interventions. Decision Sciences, Vol. 39, Issue: 2, pp. 273-315. Available from https://onlinelibrary.wiley.com/doi/full/10.1111/j.1540-5915.2008.00192.x


SIX DS TO WIN THE RED QUEEN’S RACE: THE DISRUPTION OF ONLINE JOURNALISM

Todays competition in many industries is like the Red Queen’s race: “It takes all the running you can do, to keep in the same place. If you want to get somewhere else, you must run at least twice as fast as that!”. This chapter of Lewis Carroll’s book Through the Looking-Glass (1871),describes the situation in which Alice is chased by the Red Queen and even though she is constantly running, she is only remaining the same spot. This symbolises the fierce race of competition in the current economy, as companies must pull out all the stops, just to stay relevant in the market.

When the book was written, in 1871, the solution to get rid of the Red Queen was to run twice as fast, but in todays economy you should run twice as smart to win the race. In an economy where disruption is not an exception anymore, you are always one innovation away from getting wiped out (Armit & Zott, 2012)

While you are reading this article on consumervaluecreation.com, you are actually the witness of the outcome of the disruptive transformation of journalism. How did journalism transform from a mass production of  newspapers and magazines to an extensive supply of co-created platforms like this? Diamandis and Kotler (2016), from the Singularity University have developed a chain reaction of Six Ds, which lead to exponential growth and disruption. There are six key steps in exponential growth of an organization: digitization, deception, disruption, demonetization, dematerialization and democratization.

Figure 1: A visual representation of the 6 Ds

Digitization

A few decades ago, journalism existed of the mass production of physical newspapers and magazines. It provided the reader with a limited amount of identical information, which was in a fixed ordering sold to the mass market. With the rise of the internet, journalism is no longer based on pressing longitudinal articles in a magazine, but by sharing the information represented in ones and zeros, journalism has changes into a technology and entered the exponential growth.

Deception

When something is digitized, the initial period of growth is deceptive. As it is an exponential growth, it takes very long before you grow from 0,01 to 2, but 2 quickly becomes 16, which becomes 16.000 impressively fast. Internet already existed in 1990, the first commercial newspaper was online in 1996 (Van de Heijden, 2019), and the first weblog (also called blog) in The Netherlands went life in 1997, but the online journalism is only booming since 2013 (Bakker, 2018).

Figure 2: Deception and Disruption

Disruption

A market is disrupted when the new technology for the niche market becomes regular for the mainstream customers and therefore outperforms the established alternatives (Christensen, 1997). Disruption takes place when something is underperforming in first dimension, but overperforming in the secondary dimension.

The first dimension is based on the elements that are highly valued by the mainstream customer. For journalism these elements were especially the guaranteed quality of the news and the articles, trust based on expertise and having a physical newspaper or magazine of paper. In the traditional way of journalism, these aspects were captured and online journalism is underperforming on these aspects as everyone can post something on the web, there is no guarantee of objectivity or quality.

Before the existence of online journalism, it took at least twelve hours before a happening could be shared via the newspapers or flyers. Nowadays, events are spread before you know it, and it is a matter of seconds before the whole world has access to the news. Also, in the case of physical magazines and newspapers, the customer cannot personalize what articles are in there and therefore the customers pays for content they are not interested in. Via the internet the customer is not paying for the articles they are not reading. This are the two main secondary dimension aspects in which the online journalism is overperforming compared to the traditional journalism.

As the preferences of the mainstream market are changing and the boundaries are moving, online journalism is becoming more and more present in the market. This is resulting in less and les official journalist (Oremus, 2018) and more journalistic online platforms.

Figure 3: The amount of digital newspapers in the Netherlands on national (black) and regional (pink) level per year (Bakker, 2018).

As the platforms introduces a self-controlling mechanism, there is an increasing quality guarantee and as the social norms are changing, the trust-issues are decreasing. The online journalism disrupted the market.

Demonetization

Money is increasingly detached from the reckoning as online journalism becomes cheaper or even free. Nowadays, customers use the web and with a few clicks they will find a dozen of articles of their interest without paying anything. On the other hand, publishing an article used to be very expensive as it had to be checked by several people, printed on paper and then distributed to the market, but online people can upload their article or blog for a small amount of money or even for free.

Dematerialized

The magazine- and newspaper-publishers that pressed their items and distributed their product via the mailman are now focussing on their online versions and offering subscriptions on their online version only. In this way the expensive mass production is replaced by an app on the smartphone, all fitting in pocket of every customer.

Democratized

The more and more people have access to it and the broadcast of news and articles is no longer only for large organizations, but for everyone. Through online platforms, everyone with access to the web can become a journalist. This could also be seen as the outsourcing of the task of writing articles, by creating microtasks the crowd becomes the source of journalism (Tsekouras, 2019). This also includes the counterpart; as journalism is cheap and often even for free, reading news and articles is no longer for the wealthy, but for the mass market with access to internet. Business functions are no longer product-centric, but changed toward a customer-centric approach (Vargo and Lusch, 2004).

In conclusion we could state Red Queen’s Race of journalism is won by the digital platforms. By running in a smart way, though the six Ds of Diamandis and Kotler (2016), platforms like consumervaluecreation.com will be leading in the market of journalism and therefore escape from the Red Queen.

References

Armit, R. & Zott, Chr. (2012) Creating Value Through Business Model Innovation. MIT Sloan Management Review, Vol. 53 (3), 41-49.

Bakker, P. (2018, April 18). Digitale oplage kranten blijft fors stijgen. Retrieved from Stimuleringsfons voor de Journalistiek: https://www.svdj.nl/de-stand-van-de-nieuwsmedia/digitale-oplage-kranten-stijgen/

Carroll, L. (1871). Through the Looking-Glass.

Christensen, C.M. (1997). The Innovator’s Dilemma: When New Technologies Cause Great Firms to   Fail. Boston: Harvard Business School Press.

Diamandis, P.H. & Kotler, S. (2016). Bold: How to Go Big, Create Wealth and Impact the World. New York: Simon & Schuster.

Oremus, F. (2018, October 4). Verhouding communicatieprofessionals-journalisten. Wat zeggen de cijfers? Retrieved from Villamedia: https://www.villamedia.nl/artikel/verhouding-communicatieprofessionals-journalisten.-wat-zeggen-de-cijfers

Tsekouras, D. (2019, Februari 14). Customer Centric Digital Commerce Lecture 3.

Van der Heijden, Chr. (2019, February 24). 25 jaar digitale transitie van de journalistiek 1: Opmaat. Retrieved from Journalismlab: https://www.journalismlab.nl/25-jaar-digitale-transitie-van-de-journalistiek/

Vargo, S.L. and Lusch, R.F. (2004), Evolving to a new dominant logic for marketing, Journal of Marketing, Vol. 68, (1), 1‐17.

Gamification: The Holy Grail of Customer Engagement?


Do you like learning languages? If so, you are probably familiar with Duolingo, a compelling example of the power of gamification. Duolingo, one of the world’s most popular language-learning platforms, sets itself apart by pouring gamification into every lesson. At Duolingo each lesson forms a bite-size skill that makes you feel like you are playing a mini-game. You score points when you give the right answer, while you lose hearts when you make a mistake. You are challenged to race against the clock, while you are stimulated to maintain your streak count. Like in many games, you can earn rewards, such as “lingots”, Duolingo’s own virtual currency, with which you are able to unlock even more content on the platform. The result: An engaged community of 300 million users who learn on average in 34 hours the equivalent of one full semester of college (Vesselinov & Grego, 2012).

An example of how Duolingo applies game elements in their lessons.
Source: https://yukaichou.com/gamification-examples/top-10-education-gamification-examples/attachment/duolingo-gamification/

The gamification hype       

Gamification is defined as a design approach that is concerned with applying typical game elements, such as competitions, points and rewards, to non-game contexts (Murray, Exton, Buckley, Exton, & DeWille, 2018). Duolingo along with other exemplars, such as Nike+ Fuel, My Starbucks Rewards and SAP Community Network, boosted the global gamification hype that took off in 2010 (Yu-Kai Chou, 2018). But, like most other innovations, gamification followed the curve of Gartner’s Hype Cycle (Simões, 2015). In 2013, during the peak period of inflated expectations, companies were massively trying to adopt game elements, such as points, badges and leaderboards, into their services (Scicluna, 2017). However, in their endeavor to avoid falling behind, many companies rushed their solutions without carefully considering a logical underlying game design to create an engaging experience (Scicluna, 2017). As a consequence of this “bandwagon effect”, 2014 marked a period of disappointment, in which many gamified solutions failed (Broer, 2014). Ever since 2014 gamification has not been on Gartner’s Hype Cycle (Downer, 2018).

Is this a sign that we should forget about gamification or are we already at a plateau of productivity?

Gartner’s Gamification Hype Cycle
Source: https://medium.com/casumo/gamification-is-a-fad-shall-we-call-it-motivational-design-5c8c836f4fc8

The Science Behind Gamification

To understand the value of gamification we first have to understand the science behind it. In consumer behavior theory, products and brand attitudes are generally conceptualized along two dimensions: hedonic and utilitarian (Voss, Spangenberg, & Grohmann, 2003). The term hedonic stems from the Greek word hēdonē (ἡδονή), which translates to “pleasure” (Vocabulary.com, 2019). In ancient Greek mythology Hedone was also the goddess and the personification of sensual pleasure and enjoyment (George, 2018). Accordingly, in consumer behavior theory hedonic goods are defined as goods that are consumed for pleasure and enjoyment (Voss et al., 2003). Hedonic goods are bought for the sake of the goods themselves (Koivisto & Hamari, 2019). On the other hand, utilitarian goods are used for their instrumental-value (Liu, Santhanam, & Webster, 2017). They are used to reach a particular goal that is external to the good itself (Koivisto & Hamari, 2019). Consequently, utilitarian goods derive their usefulness from their practicality and productivity. From a motivational viewpoint the use of a hedonic good is characterized as an intrinsically motivated action, while the use of a utilitarian good is considered as an extrinsically motivated action (Koivisto & Hamari, 2019).

Just like goods, information systems can be classified as hedonic and utilitarian (van der Heijden, 2017). While information systems have historically been considered one-dimensionally as either hedonic or utilitarian, recent literature has recognized that information systems are often a mix of the two (Voss et al., 2003). Nowadays, information systems are increasingly designed from scratch to serve both hedonic and utilitarian needs to increase customer engagement (Koivisto & Hamari, 2019). The idea of such mixed systems is to cater a diverse set of motivational needs into one single motivational information system (Koivisto & Hamari, 2019). The goal of a motivational information system is “to achieve productivity through fun” (Hamari & Keronen, 2017) . However, as the undermining effect of external rewards shows, combining different motivational needs in an effective way can be a very challenging task (Burtch, Hong, Bapna, & Griskevicius, 2016).

This is where gamification comes into play. The theory of self-determination states that intrinsic motivation mainly derives from three motivational needs: competence, autonomy and relatedness (Liu, Santhanam, & Webster, 2017). Throughout the literature, games are widely recognized as a means to satisfy these three motivational needs (Koivisto & Hamari, 2019). Through gamification motivational information systems are able to satisfy these needs as well. Duolingo, for example, offers competence by creating a challenging environment that provides users with a feeling of mastery. Duolingo also offers a sense of autonomy through their divers set of lessons that provide users with a feeling of choice. Furthermore, Duolingo offers relatedness through the social components that allow users to both compete and cooperate with each other.

Not a silver bullet

The fact that so many gamification projects fail teaches us that gamification by itself is not a silver bullet for customer engagement (Post, 2014). As Gartner’s research vice present, Brian Burke (2014), put it:

“Poor game design is one of the key failings of many gamified applications today. The focus is on the obvious game mechanics, such as points, badges and leader boards, rather than the more subtle and more important game design elements, such as balancing competition and collaboration, or defining a meaningful game economy. As a result, in many cases, organizations are simply counting points, slapping meaningless badges on activities and creating gamified applications that are simply not engaging for the target audience.”

Besides the common pitfall of “pointification”, the merits of gamification also need to be legal and ethical (Werbach & Hunter, 2012). A grocery store owner in Iowa learned this lesson the hard way. He thought it was a good idea to motivate his workers by organizing a “fire-contest” (Fastenberg, 2011). While he promised a cash price to every worker that rightly guessed who would be fired next, he ended up paying for their voluntarily resignation (Miller, 2011).

Negligent gamification could also lead to manipulation and exploitation (Werbach & Hunter, 2012). Laundry workers of the Disneyland hotel in California, for example, renamed their leaderboard system “the electronic whip” (Allen, 2011). After the system was implemented, the progress of the workers was continually tracked and prominently shown on huge flat screen TVs in laundry rooms (Allen, 2011). The system had a large impact on the competitiveness of the working environment (Werbach & Hunter, 2012). Employee relationships started to intensify, lower-ranked employees began to worry about their jobs, and some workers even stopped using their bathroom breaks to increase their rankings (Werbach & Hunter, 2012).

Disneyland’s Electronic Wip Persiflage
Source: https://boingboing.net/2018/11/03/neotaylorism.html

Conclusion

So, should gamification be used as a means to increase customer engagement? As with many business issues, the answer is: “it depends”. We have learned that gamification is not a silver bullet and that implementing it may lead to unforeseen consequences. Yet, if prudently designed, gamification is able to significantly increase customer engagement.

Companies willing to adopt gamification should first learn how to think like game designers. Before embracing game elements, companies should have a thorough understanding of the rules of motivation. To obtain these capabilities companies could consider hiring talented game designers and consider applying one of the many gamification design frameworks out there.

We can conclude that gamification might not be the holy grail of customer engagement, but it is definitely not going away soon either. While the hype maybe over, we probably just started to tap the plateau of productivity.

I hope that this article has given you a different perspective on motivation. Do you know great success stories of gamification? Please let them know in the comment section below!

References

Allen, F. E. (2011). Disneyland Uses “Electronic Whip” on Employees. Retrieved March 11, 2019, from https://www.forbes.com/sites/frederickallen/2011/10/21/disneyland-uses-electronic-whip-on-employees/#4fcf99e51b32

Broer, J. (2014). Gamification and the Trough of Disillusionment. Mensch & Computer 2014 – Workshopband, 389–396. https://doi.org/10.1524/9783110344509.389

Burke, B. (2014). Gamify: How Gamification Motivates People to Do Extraordinary Things. Retrieved from https://www-oreilly-com.eur.idm.oclc.org/library/view/gamify-how-gamification/9781937134860/chapter010.html

Burtch, G., Hong, Y., Bapna, R., & Griskevicius, V. (2016). Stimulating Online Reviews by Combining Financial Incentives and Social Norms. Ssrn, (March 2019). https://doi.org/10.2139/ssrn.2848398

Downer, K. (2018). Gamification – From Player to Professional -. Retrieved March 11, 2019, from https://ps-ee.com/gamification-from-player-to-professional/

Fastenberg, D. (2011). Workers Quit After Boss Starts “Guess Who Gets Fired Next” Contest – AOL Finance. Retrieved March 11, 2019, from https://www.aol.com/2011/10/07/workers-quit-after-boss-starts-guess-who-gets-fired-next-conte/?guccounter=1&guce_referrer_us=aHR0cHM6Ly93d3cuZ29vZ2xlLmNvbS8&guce_referrer_cs=YIYuo2RgpawxIO-SDlI7FA

George, J. J. (2018). Greek Mythology: Eros & Psyche | Owlcation. Retrieved March 11, 2019, from https://owlcation.com/humanities/Greek-Mythology-Eros-Psyche

Hamari, J., & Keronen, L. (2017). Why do people play games? A meta-analysis. International Journal of Information Management, 37(3), 125–141. https://doi.org/10.1016/j.ijinfomgt.2017.01.006

Koivisto, J., & Hamari, J. (2019). The rise of motivational information systems: A review of gamification research. International Journal of Information Management, 45(October 2018), 191–210. https://doi.org/10.1016/j.ijinfomgt.2018.10.013

Liu, D., Santhanam, R., & Webster, J. (2017). Toward Meaningful E Ngagement : a F Ramework for D Esign and R Esearch of G Amified. MIS Quarterly, 41(4), 1011–1034. https://doi.org/10.25300/MISQ/2017/41.4.01

Miller, D. (2011). Company that offered employees $10 to guess next worker to be fired | Daily Mail Online. Retrieved March 11, 2019, from https://www.dailymail.co.uk/news/article-2045027/Company-offered-employees-10-guess-worker-fired.html

Murray, L., Exton, C., Buckley, J., Exton, G., & DeWille, T. (2018). A Gamification–Motivation Design Framework for Educational Software Developers. Journal of Educational Technology Systems, 47(1), 101–127. https://doi.org/10.1177/0047239518783153

Post, R. (2014). Game on: could gamification help business change behaviour? | Guardian Sustainable Business | The Guardian. Retrieved March 11, 2019, from https://www.theguardian.com/sustainable-business/game-on-gamification-business-change-behavior

Scicluna, C. (2017). Gamification is a fad. Shall we call it Motivational Design? Retrieved March 11, 2019, from https://medium.com/casumo/gamification-is-a-fad-shall-we-call-it-motivational-design-5c8c836f4fc8

Simões, J. (2015). Using Gamification to Improve Participation in a Social Learning Environment. 4th International Conference on Personal Learning Environments, (November 2015), 169–186. https://doi.org/10.13140/RG.2.1.4253.0328

van der Heijden. (2017). User Acceptance of Hedonic Information Systems. MIS Quarterly, 28(4), 695. https://doi.org/10.2307/25148660

Vesselinov, R., & Grego, J. (2012). Duolingo Effectiveness Study. City University of New York, (December 2012), 1–25.

Vocabulary.com. (2019). hedonism – Dictionary Definition : Vocabulary.com. Retrieved March 11, 2019, from https://www.vocabulary.com/dictionary/hedonism

Voss, K. E., Spangenberg, E. R., & Grohmann, B. (2003). Measuring the Hedonic and Utilitarian Dimensions of Consumer Attitude. Journal of Marketing Research, 40(3), 310–320. https://doi.org/10.1509/jmkr.40.3.310.19238

Werbach, K., & Hunter, D. (2012). For the Win: How Game Thinking Can Revolutionize Your Business. Game Thinking. Even Ninja Monkeys Like to Play: Gamification, Game Thinking and Motivational Design. Retrieved from https://www.amazon.com/Win-Game-Thinking-Revolutionize-Business/dp/1613630239

Yu-Kai Chou. (2018). Top 10 Marketing Gamification Cases You Won’t Forget. Retrieved March 11, 2019, from https://yukaichou.com/gamification-examples/top-10-marketing-gamification-cases-remember/#.WvHlx1SpnyU

How feelings of pride and respect affect ongoing member activity on crowdsourcing platforms.


After a long day you are called in by your boss to meet her at her office. You are exhausted, because you have been working hard lately for a high status company. Your boss compliments you and is impressed with your work. At the end of that day, you leave the office with extra motivation to keep putting in the effort. This anecdote serves as an illustration of how traditional companies can motivate their employees to keep them happy and productive. Recently, the advancements in technology have made it possible for traditional firms to organize their work over the internet and source particular tasks to an online crowd of independent contractors referred to as crowdsourcing (Afuah and Tucci, 2012). Workers on so-called crowdsourcing platforms, like Amazon Mechanical Turk and Deliveroo, work on a voluntary basis as they are not formal employees of the company. Therefore, it is interesting to look at what drives this new generation of crowd workers in contrast to traditional employees to actively participate on these platforms as this is currently not well understood.

Nowadays, organizations use crowdsourcing for different purposes such as problem solving, idea generation, information pooling, or outsourcing tasks (Tsekouras, 2019). Companies use the crowd as they might be able to solve certain problems faster and cheaper than in house employees (Blohm et al, 2018). Hence, from a firms’ perspective it becomes evident to use the crowd as it allows for lower transaction costs, repetitive tasks that require human intelligence and keeping control over sensitive data by splitting up the tasks (Tsekouras, 2019). Although you might think you have never participated in a crowdsourcing task, most of you have even unintentionally. To illustrate, Google uses your search history to look for interesting keywords for ads (Kitter et al., 2008). 

From a crowd workers’ perspective, it is harder to trace the drivers. Why would you participate on a crowdsourcing platform? There are of course factors such as under- and unemployment which may drive people towards crowdsourcing platforms for obvious reasons such as money (Burtch et al, 2018). Nonetheless, there are also less straightforward motives such as glory, love, or a product reward as drivers for contribution (Tsekouras, 2019). To frame it from a customer-centric perspective, customers get the opportunity to speak their minds about product solutions and in that way reduce the costs of firms to obtain detailed consumer information (Tsekouras, 2019). In other words, you might benefit from the information pooling of companies. You might have an interesting feature for Apple that you want them to introduce in their new Iphone.

For the survival of a platform it is important to drive members for continuous cooperative behavior, referring back to the earlier mentioned voluntary nature. In a way, members of crowdsourcing platforms can be seen as a community in which attachment is crucial for success (Ren et al., 2012; Boons et al., 2015). Consequently, a study by Boons et al. (2015) was conducted to look into feelings of pride and respect as drivers of ongoing member activity on crowdsourcing platforms. The non-traditional work setting of crowd workers asks for a research method which is able to explain member activity on a voluntary basis. Therefore, the engagement model was used as it is capable of measuring cooperative behaviors in groups in a voluntary setting (Boons et al. 2015). The engagement model measures identification with the firm to increase activity as a result from perceived feelings of pride and respect. 

Think of the anecdote in the introduction, the compliment you got from your boss. You were positively evaluated by someone which made you feel respected (Boons et al., 2015). Furthermore, the organization is one with high regard which gives you a feeling of pride. Due to these two factors you are more likely to identify with your group of colleagues and the company. This identification gave you the extra motivation to keep putting in the effort.  However, according to Boons et al. (2015) it may be difficult to compare a crowdsourcing platform to a traditional firm as they are virtual organizations lacking the physical proximity and interaction. In contrast, they argue that it is still possible to use the engagement model as members are able to develop a sense of pride and respect based on an autonomous evaluation against personally held norms and standards (Boons et al., 2015). This is in harmony with initial thoughts of Ren et al. (2012) as they do not expect the identification process to be dependent on bonding with other members. Therefore, the engagement model is expected to fit the needs of this research.  

The authors collected data from a platform that matches organizations, that seek for idea generation, to its community of solvers. A survey was conducted amongst its members (n=153) who had participated on tasks and received feedback. The survey looked into the three earlier discussed items pride, perceived respect and organizational identification (Boons et al., 2015). These items suggest a positive cue which in turn could lead to active participation. The authors found that only pride was an important predictor of member participation (figure 1). However, the authors did not find support for perceived respect and organizational identification as predictors of ongoing member activity. Although, perceived respect and pride both were positively related to organizational identification (Figure 2). These findings implicate that the authors were able to use the engagement model in a non-traditional setting to find drivers on crowdsourcing platforms (Boons et al., 2015). Furthermore, they contribute to literature by suggesting that in a crowdsourcing setting the perceived organizational identification is inferior to pride for member activity. 

So, how can you increase pride to enhance members’ performance? As a platform leader you can benefit from this research by increasing members’ pride by communicating positive media attention about your platform. Your community will associate positive news items with the status of the organization as a whole thereby increasing members pride and activity. 

To conclude, crowdsourcing platforms differ a lot from traditional organizations in terms of interaction with workers. Therefore, finding out what drives them is important and was not well understood. However, Boons et al. (2015) build on the engagement model to find out what drives members’ activity influenced by feelings of pride and respect. They contribute to existing literature by successfully using the engagement model in another setting than traditional companies. Furthermore, they found support for pride as a driver for ongoing member activity.

Bibliography:

Afuah, A., & Tucci, C. L. (2012). Crowdsourcing as a solution to distant search. Academy of Management Review37(3), 355-375.

Boons, M., Stam, D., & Barkema, H. G. (2015). Feelings of pride and respect as drivers of ongoing member activity on crowdsourcing platforms. Journal of Management studies, 52(6), 717-741.

Burtch, G., Ghose, A., & Wattal, S. (2013). An empirical examination of the antecedents and consequences of contribution patterns in crowd-funded markets. Information Systems Research, 24(3), 499-519.

Kittur, A., Chi, E. H., & Suh, B. (2008, April). Crowdsourcing user studies with Mechanical Turk. In Proceedings of the SIGCHI conference on human factors in computing systems(pp. 453-456). ACM.

Ren, Y., Harper, F. M., Drenner, S., Terveen, L., Kiesler, S., Riedl, J., & Kraut, R. E. (2012). Building member attachment in online communities: Applying theories of group identity and interpersonal bonds. Mis Quarterly, 841-864.

Tsekouras, D.K. 2019. Lecture 3: Crowdsourcing

Interpreting Social Identity in Online Brand Communities: Considering Posters and Lurkers


Introduction

The increasing use of online communication and advertising practices has led to a rising interest in understanding the drivers and influencing factors of consumers in terms of their interactions with brands. The research paper of Mousavi et al. (2017) has set its focus on online brand communities (OBCs). These are defined as “specialized, geographically non-bound communities, based on a structured set of social relations among admirers of a brand” (Muniz & O’Guinn, 2001). OCBs were found to be marketing instruments that increase customer loyalty and commitment towards a brand (Hartmann et al., 2015). Until now, most research in this field had its focus on the behavior of active members (“posters”) in OBCs. However, so-called “lurkers” represent the vast majority of online communities (>90%). This is why recent research has become interested in finding out more about the motivations behind passively consuming information on online communities. The paper investigates this question and extends it with the examination of the effects of OBCs on brand commitment, positive word-of-mouth, and resistance to negative information.

What differentiates posters from lurkers?

The researchers base their reasoning on the theory of social identity formation: Social identity is a person’s sense of who they are based on their group membership(s).[i] According to the theory, there are two different routes of social identity formation (Postmes, Haslam, & Swaab, 2005):

The inductive route which has its basis in interactive participation in groups (bottom-up process). In the context of online communities, former research has shown that inductive social identity formation can result in higher identification than deductive social identity formation. According to this theory, posters will form a stronger social identity than lurkers because of more experience of involvement in the group tasks which leads to a greater emotional attachment.

The deductive route is a top-down process of self-categorization which is based on a response to the perceptions of shared characteristics within the group. This one does not require active participation, hence social identity is acquired by lurkers without active participation. According to this theory, lurkers are not nonproductive and nonparticipant. Their passive information consumption is a positive activity and a means of acquiring knowledge that guides future behavior.

This study investigates the mediating role of social identity in OBCs on brand commitment. In their hypotheses, the researchers expected the components of social identity (which are illustrated in figure 1) to have a stronger effect if people fall into the “poster” category.

Methodology

For the data collection, an online survey was carried out. No specific online community was targeted; people had to indicate whether they were members of OBCs after having given them some examples for OBCs. Therefore, the sample consisted of participants from a wide variety of different online communities, which the researchers saw as an advantage in terms of generalizability. 752 usable questionnaires were collected, consisting of 55% lurkers and 45% posters. Using multi-sample analyses, the researchers tested the hypotheses for the moderating effects of members’ participation type for posters and lurkers.

Main findings

The results suggest that, in general, being part of an OBC cultivates customers brand commitment. This leads to greater positive WOM and higher resistance to negative information consumers may hear about the brand. Although lurkers do not visibly participate in the community, they are as likely as posters to feel the sense of belonging to the community. They do see themselves as members, and so identify with the brand community and experience a social identity. The different components of social identity in OBCs for both posters and lurkers stimulate brand commitment, positive WOM, and resistance to negative information for both groups.

Fig.1: Comparison between posters and lurkers. Source: Mousavi et al. (2017)

Discussion

The research gives useful insights into the consumer behavior in the context of online brand communities. Given the fact that the majority of their visitors are lurkers, it is interesting that most prior research had its focus on only the active members. Mousavi et al. (2017) filled a gap with their study by finding out that lurkers also feel part of the community. The researchers suggest to further investigate the influences of marketing techniques on visitors who prefer to passively consume the contents of online communities. The fact that such a huge majority of people are classified as lurkers, yet prior research had mainly focused on the active members, gives ground to further explore the behavior and motivations of the passive members.

References

Hartmann, B. J., Wiertz, C., & Arnould, E. J. (2015). Exploring consumptive moments of value-creating practice in online community. Psychology & Marketing, 32, 319–340.

Mousavi, S. , Roper, S. and Keeling, K. A. (2017), Interpreting Social Identity in Online Brand Communities: Considering Posters and Lurkers. Psychol. Mark., 34: 376-393. doi:10.1002/mar.20995

Muniz, A., & O’Guinn, T. (2001). Brand community. Journal of Consumer Research, 27(4), 412-432.

Postmes, T., Haslam, S. A., & Swaab, R. I. (2005). Social influence in small groups: An interactive model of social identity formation. European Review of Social Psychology, 16, 1-42.


[i] https://www.simplypsychology.org/social-identity-theory.html

From e-commerce to Re-commerce: rediscovering fashion on Vestiaire Collective’s digital platform


Context

We are all familiar with online peer-to-peer marketplaces, such as eBay, serving as online platforms to buy and sell preowned items. The secondary market has grown exponentially in the past decade (Gorra, 2019), and the fashion industry is no exception to this trend. With the growing fashion consciousness of consumers and spending awareness habits since the recession, it is no surprise that the fashion industry followed this path of “re-commerce”. In recent years, many online preowned fashion marketplaces started to pop up, focusing on the resale of preowned fashion and luxury products. One of them is Vestiaire Collective – “a leading global marketplace and community for preowned luxury and designer fashion” (Pallardo, 2017).

Introduction to Vestiaire Collective

Launched in 2009, Vestiaire Collective (VC) had the mission to extend the lifespan of beautiful luxury fashion pieces by bringing them back into circulation (“Vestiaire Collective”, n.d.). With over 7 million members located in over 50 countries, VC has established itself as one of the global leaders in fashion and luxury resale. The difference between VC and other preowned luxury and fashion marketplaces is that it focusses on the peer-to-peer interaction (buyers buy from sellers). Other competitors, such as The RealReal, have consignment models (sellers receive a listing price up front from a company that then puts the item for sale) and therefore focus on the business-to-consumer interaction. VC therefore has no inventory, yet leverages that of its customers’.

How does the platform work?

Access to the platform is only granted by becoming a member. Sellers can submit their item on the platform, which VC then evaluates. The item can be accepted, negotiated a different listing price, or declined. If accepted, VC lists the item on their platform (Figure 1). Once an item is sold, the seller ships the item with a prepaid shipping label (paid for by VC) to one of VC’s offices where thorough authentication and quality control of the item is conducted. VC’s experts then make sure the item is not counterfeited and in the expected state. Finally, if the item passes quality control, it is shipped to the buyer and the seller gets paid. 

Vestiaire Collective’s Business Model

The platform mainly earns revenue from collecting commission fees for every item sold on their platform. Roughly 1000 to 2000 pieces undergo quality control every day and an average basket is worth €400 (Pallardo, 2017). VC takes between 18% and 34% commission, depending on the listing price (“Vestiaire Collective FAQ”, n.d.). This fee includes the free shipment of the sold product to one of VC’s offices and quality control services. 

Why Vestiaire Collective?

One might wonder why sellers choose to list their items on VC instead of on other platforms where commission rates are significantly lower (for example, eBay charges a maximum of 10% (“eBay Customer Service”, n.d.)). Essentially, sellers must make a trade-off between lower commission rates and the benefits of VC’s platform. Many sellers, including myself, are choosing for the latter. 

Figure 1: Article for inspiration written by VC (right), and example of listing (left).
Source: Screenshot in app.

Expertise

VC is specialised in luxury fashion. Although rivals such as eBay are large in the secondary market, they are not specialised in luxury goods. VC is also proactive with its members, creating a lot of content around their platform, educating them about fast-moving products and brands, and providing them with information on the latest trends (Figure 1). Once in a while special sales are organised to connect with members on a different level by featuring items for sale of famous influencers.

Convenience and scope

Listing an item is easy. VC step-by-step guides sellers in this process, and along the way, educates them on how more information and better images can increase sale likelihood and seller trustworthiness. Furthermore, shipping costs to VC’s office for quality control is prepaid, regardless of where in the world the buyer lives. Sellers simply print out the prepaid shipping label. No need for exchange of personal information. VC reliefs sellers from language barriers and the burden of having to factor in shipping costs, and simultaneously broadens sales reach. 

Figure 2: “Resale Calculator” feature in app (right), and Notification page (left)
Source: Screenshot in app.

Semi-anonymous peer-to-peer interaction

As a member of the community, you are not anonymous; names, countries and number of sold items are disclosed. However, as a bidder and buyer you are (Figure 2 and 3). Members cannot directly or privately contact each other, but can publicly comment on and “like” the item to ask questions and to give the community an indication of popularity of the item (Figure 2). Although direct contact among members is not possible, the main interaction on the platform is between peers. The platform basically functions as facilitator and regulator, by allowing peer-to-peer trade and ensuring ethical behaviour.

Figure 3: Negotiation area. After three rounds the (anonymous) bidder/buyer can no longer make an offer.
Source: Screenshot in app.

Trust in the platform: no market for lemons

VC’s community is built on trust, maintained by the rules and regulations of the platform. Members’ inability to send each other private messages does not restrict them from obtaining the right information about products and sellers. The quality control service protects buyers from counterfeit, and makes sure accurate information is provided by sellers on product condition (Figure 4). Additionally, members will not be cheated on. VC is a semi-centralized platform in terms of pricing. Sellers’ listing price must be accepted by VC to avoid extremely high prices (Figure 2). Also, buyers cannot offer sellers a price lower than 30% below the listing price, so sellers can anticipate their earnings up front. With its semi-centralised pricing system and trustworthiness, VC avoids a market for lemons, and assures fair prices for fair trade.

Figure 4: Vestiaire Collectives quality control department (Bertrand, 2016).
Source: http://www.lesechos.fr

Opportunities and Challenges for Vestiaire Collective

Internal

VC’s trustworthiness has come at a cost, and still costs them a lot of money. Authenticating sold products is at the core of their business and trustworthiness. However, it is also one of their most expensive processes. The prepaid shipping label VC provides their sellers with, is extremely expensive, especially when items are deemed inaccurate and thus do not pass quality control. One of VC’s internal challenges is therefore to find more efficient ways of authenticating items. One interesting opportunity that requires adaptation from the entire fashion industry, is the use of Blockchain technology. Authentication could then be validated by the chain, instead of by expensive experts, and simultaneously mitigates shipping costs. Items that are especially susceptible to counterfeit often carry unique reference numbers that are registered at the manufacturer. Although a long shot, it might be interesting for VC to explore the possibilities of Blockchain for their business.

External

“The more products sold in the boutique, the more products sold on the secondary market” (Sherman, 2017). VC’s focus is on expanding to other countries and increasing user base to obtain more supply to fuel the marketplace. With a total funding of $130 million, VC therefore continues to expand their marketplace to China (Milnes, 2017), as the Chinese are the biggest spenders on luxury and making up 32% of its total spending in the global market (Pymnts, 2018). However, like every platform or online community, its success depends on member engagement, which in VC’s case is members’ willingness to put their items for sale. VC’s external challenge is to make sellers from boutique buyers, and to make sure that sellers remain boutique buyers as well. Without “buying sellers,” the platform has nothing to sell. Re-commerce is therefore not a threat, but rather a complement to traditional or e-commerce. 

References

  1. https://www.kantox.com/en/the-difficulty-lies-in-structuring-the-business/
  2. https://www.businessoffashion.com/articles/bof-exclusive/vestiaire-collective-62-million-raise-recommerce-war-rages
  3. https://digiday.com/marketing/vestiaire-collective-paving-way-online-secondhand-luxury-china/
  4. https://digital.hbs.edu/innovation-disruption/new-normal-luxury-secondary-market/
  5. https://faq.vestiairecollective.com/hc/en-gb/articles/200429161-Calculate-our-commission
  6. https://www.ebay.com/help/selling/fees-credits-invoices/selling-fees?id=4364
  7. https://www.pymnts.com/news/retail/2018/ecommerce-china-luxury-goods-retail-tiffany/
  8. https://www.vestiairecollective.com/about/

Value co-creation in health care – New patient centric approaches


Though customer value co-creation is not a new concept, tracing back to the 1970s when it was first discussed in the business literature (Janamian et al., 2016), it might be surprising (and even shocking) to hear that it found its way into health care only recently. With more options and more information available online, patients took on an increasingly active role in their health and wellness (Elg et al., 2012). This changed the traditional view of many health care systems where consumers were seen as having a passive, receiving role (Nambisan & Nambisan, 2009). 

Consequently, today an increased focus is put on partnerships between the different participants within health systems, such as researchers, health care professionals, health care organizations and the consumer community. Especially online health communities have experienced growing popularity in recent years, both among patients and health care organizations. The advantage of these communities is that they often show strong identity-based as well as bond-based attachment between members resulting in very active groups that health care organizations try to tap into.

What are the benefits? 

For patients

  • improved health outcomes
  • increased trust in the health care system
  • reduced healthcare costs

For health care organizations

  • new innovative ideas
  • reduced cost and time to market
  • more positive perception

For the health system

  • increased efficiencies in health services
  • identification of improvement opportunities
  • reduced costs for the health system
  • increased patient satisfaction

How does it work in practice?

Nambisan and Nambisan (2009) developed a framework of consumer value co-creation in health care, differentiating between four different models. These models are resembled in the following matrix and are differentiated via two dimensions, the Nature of Leadership which can either be the consumer or the health care organization versus  the Nature of Knowledge activity, where they differentiate between knowledge creation and knowledge sharing.


Figure 1: Models of consumer value co-creation in health care (Nambisan & Nambisan, 2009)

Based on the framework we can classify existing practices based on their related consumer value co-creation model. A Partnership Model is characterized according to Nambisan and Nambisan (2009) by an online health community that participates in activities that are led by health care organizations to create new knowledge. An example are for instance online communities where organizations reach out to patients for clinical trials, for instance to understand the side effects of drugs. A global online health community that is especially active in this area is HealthUnlocked. The platform also enables peer support and allows users to see and contribute in over 700 health communities about specific health conditions. These communities are often run in partnership with established healthcare organizations (HealthUnlocked, 2019).


Figure 2: HealthUnlocked a social network hosting more than 700 health communities

In contrast to the previous model, Open-Source Models are characterized by consumer community led activities, sometimes also referred to as consumer centers of research (Nambisan & Nambisan, 2009). This kind of model might be especially valuable for people with rare disease that can then form communities with peers and experts and focus on the research of specific diseases. As the „crowd“ in these communities does not consist of experts, the value in insights might be limited though. Nevertheless, the social network project Panoply could be considered a successful model that started off as a relatively small open-source project which eventually resulted in a successful app that promotes well-being to combat depression (Rucker, 2017). 

Support Group Models are consumer community led forums for sharing consumers’ knowledge about a disease or treatment (Nambisan & Nambisan, 2009). Phoenix Helix is such a platform, that provides help and advice for people that suffer from auto-immune diseases (Phoenix Helix, 2019). Health care organizations could provide additional value in these communities for instance by offering complementary services or access to databases.

Finally, Diffusion Models are characterized by knowledge sharing activities initiated and led by health care organizations. These models have the potential advantage that they facilitate the diffusion of knowledge about an organizations existing or new product. Multinational pharmaceutical company GlaxoSmithKline used this model when it launched a new weight loss drug and invited 400 overweight men and women to share their experience in an online community (Nambisan & Nambisan, 2009). It should be noted however that diffusion could be both positive as well as negative.

Limitations

While the approaches discussed above can offer real value for patients, health care organizations and health system, there are some risks. In most of the above cases patient data is self reported and not always directly linked to medical records or clinical information which may result in invalid and biased data (Bhomwmick & Hribar, 2016). Moreover, some individuals in the community might be motivated by extrinsic rewards like glory or money and thus knowingly give wrong information to stick out. Furthermore, data published on online communities might be confidential and could expose very sensitive information (Bhowmick & Hribar, 2016). 

Conclusion

It is evident that online health communities can serve as valuable resources for patients as well as health care providers for value based co-creation in health care. Online health communities can positively effect efficiency, feasibility and speed of health research while engaging many customers (Bhomwick & Hribar, 2016). While focusing mainly on consumer value co-creation between the consumer and a single health care organization in this blogpost, it should be noted that health care organizations are increasingly putting efforts on working together on common ecosystem to drive digitalization and utility for the consumers, such as the platform established by Siemens Healthineers in 2017 (Siemens Healthineers, 2017). 

References

Bhowmick, A. & Hribar, C. (2016). Online Health Communities: A New Frontier in Health Research. Medium. Retrieved from https://medium.com/@abhowmick1/online-health-communities-a-new-frontier-in-health-research-71fb73edbea2.

Elg, M., Engström, J., Witell, L. & Poksinska, B. (2012). Co-creation and learning in health-care service development. Journal of Service Management, 23(3), pp.328-343.

HealthUnlocked. (2019). HealthUnlocked About Us. Retrieved from https://healthunlocked.com/about.

Janamian, T., Crossland, L. & Wells, L. (2016). On the road to value co-creation in health care: the role of consumers in defining the destination, planning the journey and sharing the drive. MJA, 204(7).

Nambisan, P. & Nambisan, S. (2009). Models of consumer value concretion in health care. Health Care Management Review, 34(4), pp.344-354.

Phoenix Helix (2019). Phoenix Helix. Retrieved from https://www.phoenixhelix.com 

Rucker, M. (2017). 5 Great Online Communities for Patients With Medical Conditions. Verywell Health. Retrieved from https://www.verywellhealth.com/great-online-communities-for-medical-patients-1739169. 

Siemens Healthineers (2017). Siemens Healthineers establishes global Digital Ecosystem to drive digitalization of healthcare. Retrieved from https://www.siemens.com/press/en/pressrelease/?press=/en/pressrelease/2017/healthineers/pr2017020180hcen.htm&content%5B%5D=HC.


How does my review affect the price of your accommodation?


The following is a review of the paper “Reviews and price on online platforms: Evidence from sentiment analysis of Airbnb reviews in Boston” by Lawani et al., (2019).


With the rise of platforms such as Airbnb, that now provides access to more than five million rooms in approximately 191 countries, the power dynamic in the traditional hospitality industry has shifted (Airbnb, n.d.). What are the reasons behind the relatively recent success of these peer-to-peer platforms, with a focus on hospitality in particular? Technological advances is one explanation for the sharing economy (P2P markets) as it made the process of connecting people with each other faster and more efficient, and significantly reduced overall costs. Subsequently, it facilitated the development of reputational systems, which is considered a major influence in overcoming moral hazard and adverse selection (Horton & Zeckhauser, 2016).

The process of making a decision on what accommodation you would like to stay at, is dependent on a multitude of factors and personal preferences. The amount of bedrooms, proximity to the city center, amenities, and price to name only a few things that can be taken under consideration. But ultimately, when the guests that came before you have merely negative experiences with the accommodation, it is unlikely that you will follow their footsteps. Lawani at al. (2019) studied the relationship between content of reviews and accommodation price in Boston. While previous research mainly focused on one-dimensional ratings such as number of reviews and star rating, this paper uses reviews as a proxy for quality.

Review

The research is focused on two main components, namely first the difference between the effect of the unidimensional ratings on price and the effect of several separate quality measures (which they constructed themselves) on the price, and secondly how quality opinions from sentiment analysis of the reviews affect price. A previous study on the effect of online reviews on sales by Hu et al. (2008) states that product reviews are one of the main indicators of quality perceived by consumers. Since research by Zervas et al. (2017) has indicated that Airbnb rentals have a negative effect on hotel revenue, they are seen as substitutes. Overall, the importance of word-of-mouth on consumer decisions has been highlighted extensively throughout multiple researches. The paper looks at the characteristics of the platform Airbnb, where hosts can determine the price of their accommodation and which services are included, while the consumers have their quality preferences and their willingness-to-pay. Guests are positively impacted by competition on the supply side, as hosts might have to lower prices or increase their quality to competitors’ standards.

Methods and main findings

Retrieved from Inside Airbnb, the researchers used a dataset of 2051 individual hosts in Boston, gathered in September 2016. This accommodation data was connected to Boston’s economic data originating from the American Community Survey, which included neighborhood variables, income measures, and education level. To overcome the unidimensionality of ratings, Lawani et al. (2019) also focus on sentiment of reviews. Furthermore, they dissect quality as a construct and develop seven other variables that each represent an aspect of quality. A sentiment analysis of reviews resulted in a score for quality for the accommodations. The remaining six quality variables are accuracy, cleanliness, check-in, communication, location, and value of the accommodation.

Among the main results from the theoretical models they find that prices for short-term accommodations are strategic complements, meaning hosts’ adopt their prices according to their competitors. Secondly, from the empirical analysis they find that the sentiment score is a better quality proxy than the rating score, since the opinions in reviews can represent more indicators of quality than a singular score. Ratings are easier to understand, while reviews provide better insights (Tsekouras, 2019). However, the six quality component variables mentioned before are better predictors of price that the sentiment score. The number of bedrooms and bathrooms as well as overall capacity are associated with higher prices. Furthermore, they found that cleanliness of the accommodation followed by accuracy of the description are the quality measures that influence price the most, which has implications for hosts that are looking to improve their competitiveness.

Evaluation

The researchers opt for a vertical product differentiation model to depict competition. One of the strengths of the paper is the comprehensibility of the profit-maximization framework. They denote that competition between Airbnb hosts in a city usually takes place within a certain mile radius, instead of over the whole city. In addition, the sentiment analysis is conducted on the reviews that were posted on Airbnb in 2016 only. Having a topical dataset is important for the analysis of reviews since consumers usually only read the most recent reviews. More generally, this research is one of the first to look at the relation between consumer review content and its effect on the price on a sharing economy platform.

One weakness of the study that is highlighted as well is that the conceptual model is completely tailored around traditional profit maximization. It is also possible that hosts deliberately lower their accommodation price to have more options to choose from. Additionally, the researchers show little regard for the implications and relevance for Airbnb hosts, especially on how they can directly derive value from reviews. Besides, it is to be expected that sentiment score from review content is a better indicator of quality than a unidimensional rating. A rating represents the overall impression of the accommodation, but can also reflect discontent with only one aspect of the experience, while reviews allow for a more complete image. The academic relevance of that result is therefore lower compared to the other findings.

Sources

Airbnb. (n.d.) About us [online]. Available at: https://press.airbnb.com/about-us/ [Accessed 9 March, 2019].

Edelman, B., Luca, M. & Svirsky, D. (2017). Racial Discrimination in the Sharing Economy: Evidence from a Field Experiment. American Economic Journal: Applied Economics. Nr. 9(2), pp. 1-22.

Horton, J.J. & Zeckhauser, R.J. (2016).  Owning, Using and Renting: Some Simple Economics of the “Sharing Economy”. National Bureau of Economic Research, Inc. [online]. Available at: https://www-nber-org.eur.idm.oclc.org/papers/w22029.pdf [Accessed 9 March, 2019].

Hu, N., Liu, L., Zhang, J.J. (2008). Do online reviews affect product sales? The role of reviewer characteristics and temporal effects. Information Technology Management. Nr. 9, pp. 201–214.

Tsekouras, D. (2019). CCDC.

Zervas, G., Proserpio, D., Byers, J.W. (2017). The rise of the sharing economy: estimating the impact of Airbnb on the hotel industry. Journal of Marketing Research. Nr. 54, pp. 687–705.


Towards the Future of Retail


It is the end of the season and we all know what that means: time for SALE! Whether we like it or not, many of us are drawn to the shops with the biggest red letters on the window screaming about how they reduced their prices of some of their products to even 70 %… However, shopping during sale periods if often not the most pleasurable time to hit the shops.

As a resort many of us shift to online shopping where products are perfectly displayed on beautiful models and you don’t have to dodge elbows from fellow shoppers while diving into a pile of shirts. Nonetheless, this might not be a perfect customer experience either, as our perfectly displayed dress in the web shop is often disillusioned and the real product leaves us disappointed upon arrival.

Now I hear you wonder… how can we solve these problems and create a better customer retail experience? Do not worry; the answer is radio-frequency identification (RFID). RFID is a technology used to read and/or save information of RFID-tag labelled products such as paper tags. The technology was first discovered in 1945 and has been patented in 1983 by Charles Walton (Barcoding, n.d.). Opposed to traditional barcode techniques, each RFID-tag is uniquely identifiable and can store more specified information for the tagged product. Ever since, the technology has experienced extensive development and is currently used in many industries ranging from security, to advertisement, and mobility to live-stock. In retail environments we for example have already seen RFID-tags to protect valuable products in our local drugstore from being stolen.

As the technology has been growing over time, the price of a simple RFID-tag has been reduced to 10 cents (Barcoding Inc., n.d.). Now that might seem very cheap, however, when all products in a store need to be labelled this will add up to quite a substantial amount of money. So what exactly are the benefits of using these RFID-tags in your favourite retail store?

Example of an RFID tag used to label products.

Security Benefits
For all shoplifters among us, this might be rather a downside than a benefit. With RFIS-tag labelled products, the security systems of stores can be significantly improved to better the customer experience. Normally, when you walk into a shop, you are welcomed by security gates with which shops are essentially saying: Feel free to check out our product, but be careful, we know you might steal!. New technologies using RFID-scanners are able to operate more precisely and therefore capable of scanning products from a bigger distance in a more distinct area. This allows for the development of overhead scanners at the entrance of shop that are nearly invisible for the customer (Nedap Retail, 2019b). Furthermore, the labels will contain more information about the products they are attached to and while checking out information about the sales status can immediately be updated (Nedap Retail, 2019b). Therefore, less security details such as pins need to be added as the label itself can signal immediately if it is being stolen. Lastly, once certain products are identified to be stolen more often, increased security measures can be taken such as giving the product a more prominent display in the store or adding traditional prevention measures such as colour bombs and security pins (Nedap Retail, 2019b). The difference is that this will now only need to be used for products that are frequently stolen rather than every product that shows increased value.  

Example of overhead scanner at the shop entrance.

Recommendation in fitting room
Another benefit comes in the fitting room. With the uniquely identifiable labels, shops might in the future be able to build recommendation systems based on what products customers bring to their fitting room and decide not to buy (GDR, 2019). Once data is more incorporated within the business, shops can create a system in which customers create a profile that collects information about what the customers likes (GDR, 2019). This may start with online browsing behaviour, but can be extended to the fitting room where items can be scanned, and customers can indicate what they liked or did not like. Based on the input information, the system can give recommendations on products with for example a similar colour or a different fit if the customer indicated the product did not fit well. With this, the customer will receive better in shop recommendations without having to scan every shelf in the shop for different yet similar products. In a fully integrated supply chain where shop attendants are able to get the items for the customers once requested through the system, even more efforts for the customer are saved. This becomes especially interesting with the increased development of virtual fitting rooms where products can be tried without putting them on (GDR, 2019).

Example of a virtual fitting room with product recommendations in different colours.

Less stocking and stock-outs
As more date is being tracked on which items are exactly in the store, in the storage and being bought, less items need to be stocked-up within the shopping area. With the exact information which items are being sold in which sizes and of which colours, the personnel can instantly restore the items on display to the optimal level (Bianchi, 2017). This reduces the number of items that need to be displayed and allows for tidier stopping environment, especially during sales seasons. This becomes increasingly easy as the storage of the shop can be scanned quicker as well. With the RFID technology, items can be scanned through their packaging and while they are still in the box on the shelf. Therefore, it reduces time needed to find certain products while they are stored and makes it easier to replenish store displays (Nedap Retail, 2019a). Once more clarity on stock is being reached, more information can be displayed in the online environment as well where information about the current availability of the product in a specific store is displayed and regularly updated. This not only increases informativeness for customers, but the real-time updating of stock levels also lowers the chance of stock-outs when adequately used to organise the supply chain (Nedap Retail, 2019a).

Example of replenishment system working with an application for shop attendants.

All in all, a relatively simple technology such as RFID combined with a sophisticated cloud is capable of changing the retail customer experience. Storing more information in the cloud allows for a friendlier shopping environment that invites people to enter stores and creates clear overview of the products on display. Furthermore, it can compliment the online experience by creating real-time storage updates and improved recommendations both in store as well as online once products are linked to personal accounts. Therefore, the ultimate resort might no longer be just online shopping, as shops will remain tidy and we know what to expect in stores, even during the super sale times.

Barcoding, Inc. (n.d.). RFID FAQs – Barcoding, Inc.. [online] Available at: https://www.barcoding.com/resources/frequently-asked-questions-faq/rfid-faqs/ [Accessed 9 Mar. 2019].

Bianchi, J. (2017). 5 Examples of Innovative Uses for RFID Technology in Retail. [online] Shopify. Available at: https://www.shopify.com/retail/5-examples-of-innovative-uses-for-rfid-technology-in-retail [Accessed 28 Jun. 2017].

GDR. (2019). The changing face of the fitting room – GDR. [online] Available at: http://gdruk.com/changing-face-fitting-room/ [Accessed 9 Mar. 2019].

Nedap Retail. (2019). !D Cloud – Cloud-hosted RFID software – Nedap Retail. [online] Available at: https://www.nedap-retail.com/solutions/id-cloud/ [Accessed 9 Mar. 2019].

Nedap Retail. (2019). iD Top – RFID-based EAS overhead – Nedap Retail. [online] Available at: https://www.nedap-retail.com/solutions/idtop/ [Accessed 9 Mar. 2019].

How to optimize revenues in the sharing economy


What are we talking about?

Over the past decade, online peer-to-peer platforms such as Airbnb or Uber have become some of the most prominent upbringings of the sharing economy. But what is the sharing economy? Defining the concept is quite difficult, but one may define it as “the use of technology to facilitate the exchanged access of goods or services between two or more parties” (Miller, 2018). It is fast-rising and highly popular, with 44.8 million adults in the US using the sharing economy in 2016, and 86.5 million US users expected in 2021 (Miller, 2018).

So, how can those of the 44.8 million adults in the US using the sharing economy who provide services and products make the most out of this economy? The authors of the presented research intend to answer this question.

Abrate and Viglia (2019) argue that the success of products offered on online peer-to-peer platforms is influenced by the personal reputation of the seller, which is often indicated by the sellers’ credentials. This personal reputation increases the quality of the relationship of those involved in the peer-to-peer platform and reduces uncertainty in the transaction. However, the authors argue that to date there limited research available regarding revenue optimization and personal reputation, instead of product reputation. Thus, the authors intend to close this gap in research by disclosing the effects of both personal and product reputation on revenue optimization in the sharing economy.

According to the authors, there are five main concepts involved in the revenue optimization of products and services in the sharing economy. These five concepts are:

  • Shared assets, which refers the product’s physical and service characteristics
  • Product reputation, which refers to online reviews shaping consumers’ perception of a product
  • Personal reputation, which refers to the expertise of the seller
  • Potential revenues, which refers to the revenues which could objectively be achieved from a product or service
  • Achieved revenues, which refers to the actual revenues achieved from a product or service

Based on their literature review, the authors propose the following theoretical framework:

The authors test whether product and personal reputation reduce the gap between potential and achieved revenues and whether personal reputation has a stronger effect on reducing this gap.

How is it measured?

In order to test these hypotheses, the authors make use of data from Airbnb. On Airbnb, hosts can list their accommodations and rent these to guests. Here, the shared assets are the listings and their characteristics, which constrain the maximum revenues a host can achieve. The potential revenues thus depend on factors such as location and number of bedrooms. While the host tries to maximize his revenues, achieved revenues often do not match the potential revenues.

The authors take a stochastic approach to test the hypotheses and build two regression models. Without going into more detail regarding the regression model in this blog post, the authors aim at explaining the difference in potential revenues and achieved revenues with these models. They argue that the difference can be explained by reputational variables in that good reputation allows the host to outperform other hosts and thereby close the gap between potential and achieved revenues. If the host’s reputation is bad, on the other hand, the gap between potential revenues and achieved revenues increases. For both personal and product reputation, this is reflected in the regression models built by the authors.

The researchers then gathered data from the five most popular European destinations, which are Barcelona, Istanbul, London, Paris and Rome. From these cities, the researchers identified all Airbnb listings within a 2-kilometer distance from what general tourism websites determined as the main attractions of these cities. Further, the researchers set a cap at 200 listings per city.

For these listings, the researchers retrieved information on prices, availability, characteristics of the listing and reputational attributes. Personal reputation has been measured in days since registration, profile completeness and the “superhost” qualification, which is awarded by Airbnb to hosts when certain reputation requirements are satisfied. Furthermore, product reputation has been measured by professional photos of the listing and online reviews, in terms of volume and average review score.

After validating the listings, the authors were left with a sample size of 981 listings. The authors then applied their regression models.

What are the results?

The researchers found support for all three hypotheses, meaning that both product and personal reputation reduce the gap between potential and achieved revenues, but that personal reputation has a stronger effect in reducing the gap.

What can we learn from this?

The results of this research have important implications for both scholars, and managers and practitioners. For scholars, this research bridges the gap in existing literature regarding revenue optimization in the sharing economy, which has previously mostly focused on product reputation. This research also offers insights into the importance of personal reputation, stand-alone and compared to product reputation.

For managers and practitioners, this research offers statistical proof as to how to optimize revenues in the sharing economy, especially in the case of Airbnb. Hosts on Airbnb can use these insights to take measures to increase both their product and personal reputation in order to increase their revenues. Through better personal branding and building trust, hosts can increase their personal reputation and thereby reduce uncertainty in the transaction which leads to higher achieved revenues.

Finally, what are the strengths and weaknesses of this paper?

One of the strengths of this paper is that it offers a statistical approach to revenue optimization in the sharing economy. Through regression modeling based on real data from Airbnb, the authors prove the importance of both product and personal reputation.

A weakness of this paper, however, is that reputation, which is a key variable in this research, is difficult to measure. The researchers themselves acknowledge that reputation is very subjective and may not be adequately captured in this research. In future research, this issue should be tackled, possibly by validating the indicators used for assessing reputation in this study by having guests confirm or reject the host’s product and personal reputation .

Sources:

Abrate, G. & Viglia, G. (2019). Personal or Product Reputation? Optimizing Revenues in the Sharing Economy. Journal of Travel Research, 58(1), 136-148.

Miller, D. (2018). What Is The Sharing Economy (and How Is It Changing Industries)? Retrieved on March 9, 2019 from https://www.thebalancesmb.com/the-sharing-economy-and-how-it-changes-industries-4172234

Impact of Average Rating on Social Media Endorsement: The Moderating Role of Rating Dispersion and Discount Threshold


This is a review of paper “Impact of Average Rating on Social Media Endorsement: The Moderating Role of Rating Dispersion and Discount Threshold” written by Xitong Li (2018)

Facebook launched the “Like” button in February 2009. Since then, more and more social media platforms, such as Twitter, LinkedIn and Instagram, started with introducing this service for their users. This liking function can be of great value for companies using these platforms for advertising. According to a study of Li and Wu (2013), one additional Facebook Like on a sponsor ad averagely will increase the company’s revenue by 215 dollars. It is therefore very interesting for companies to investigate in the motivating factors, that cause people to like and endorse a product since it can be an important extra source of revenue. How to encourage more users to involve in a product endorsement has therefore become increasingly essential to every company in terms of strategic marketing.

Why do people endorse products?

When a user clicks the “Like” button for a sponsored product, the product will automatically be shared to his or her Facebook friends. So the main reason for people to endorse a product is to inform their friends about a good deal. Users are willing to share and endorse a product to friends if they think it is a recommendable product or they want to show their interesting for this product publicly. For some users, social media endorsement is an uneconomical bargain since they should put their self-image at risk and may not get any monetary compensation. For instance, the self-image risk arises when they endorse a product with low quality. It is therefore important for people to make sure that the deal or product they are promoting to their friends is of high quality. A method often used to get knowledge on the quality is the average rating. The research therefore investigates how online reviews about restaurants affect social media endorsement of deal vouchers sold by the restaurants.   

Research Questions

While the average rating had been studied previously, how features of averaging rating will be the cause of social media endorsement were still unclear. Li (2017) attempted to start from the rating dispersion and discount threshold to investigate how these two features affect social media endorsement. To be specific, the author hopes the paper enables to answer the following two questions,

(1) Does a higher average of review ratings about the restaurants increase social media endorsement (Facebook Likes) of deal vouchers?

(2) Do rating dispersion moderate the effect of average rating on social media endorsement?

Previous studies show two possible motivations to drive consumers’ sharing on social media endorsement, which are increasing social capital (Lin et al, 2001) and enhancing self-image (Akerlof and Kranton, 2000). A higher average rating can signal to customers that the product gain recognition from the mainstream market and customers are more willing to endorse it to their friends. However, what a large dispersion of review rating of a product means to customers can have two opposite conjectures. On the one side, a large dispersion of review rating may send a signal to customers that the product has high uncertainty on its quality (Feldman and Lynch, 1988).  On the other side, a large dispersion of review rating may imply the product is unique and niche that is more attractive to customers with well-matched preference (Clemons et al 2006, Sun 2012).

Research design

The author chose the daily-deal businesses as the research setting and the restaurant industry as the object of research. Data of restaurant deals were collected from two sources, a data set provided by Byers et al. (2012) that consists of a nationwide sample of deals across 19 major cities of the United States, and a commercial daily-deal aggregator. To exclude restaurants that may not exist or too small, the author also checked whether the profile of a restaurant can be found on Yelp. Com or not. Finally, a cross-sectional data set that includes 2,545 restaurant deals and 129,129 individual review ratings has been generated. The author regards Facebook likes endorsed for a product deal as the dependent variable and review ratings on Yelp.com as the independent variable of this paper.

Findings

The main findings of this paper are:

•    The average rating increases consumers’ endorsements via Facebook for restaurants with enough reviews.

•    The effect of average rating on social media endorsement is greater for restaurants with more dispersed review ratings.

The first finding thus confirms the expected behavior of consumers which is that a higher review rating is associated with a perceived higher quality. This makes people more willing to endorse the product, since their risk of sacrificing their self-image or their social capital is lower. The second finding is quite surprising, since it indicates that people value more dispersion in a rating over a pure opinion.

Strengths and weaknesses

One of the strengths of the paper is that it takes place in a real life setting and uses real life data. Additionally. the researcher ensures a causal relationship between the dependent and independent variable by using a regression discontinuity (RD) design. Another strength is that, it gives interesting insights on a topic where existing views exist, which can be helpful for firms using social media endorsements. Weaknesses of the paper are that it only focuss on one specific business area, making it harder to generalize the findings to other fields. Next to that the research only uses likes as endorsement measure, however in the current social media era, there are other ways to endorse such as sharing or commenting which are not included.

Managerial implications and research implications

The research generates some interesting insights on the effect of the review rating. It can be valuable to know for company to know what impact their rating has on their social media advertisements, since these advertisements can generate large amounts of additional revenue. It is therefore of great importance for companies to make sure that their average review rating is high. Secondly it generates especially important new insight for companies with niche products, that have a more dispersed rating. For these companies, it is more useful to make use of social media advertising, since they can benefit from the endorsement effect most. It can be insight full to do future research on the effect of review ratings in other business areas and to investigate what other factors can influence the social media endorsement of consumers to test if the research also stands for other services and products.

Reference

Akerlof GA, Kranton RE (2000) Economics and identity. Quart. J. Econom. 115(3):715–753.

Byers JW, Mitzenmacher M, Zervas G (2012) Daily deals: Prediction, social diffusion, and reputational ramifications. Proc. Fifth ACM Internat. Conf. Web Search Data Mining (WSDM’12) (ACM, New York), 543–552.

Clemons EK, Gao GG, Hitt LM (2006) When online reviews meet hyper differentiation: A study of the craft beer industry. J. Man-agement Inform. Systems 23(2):149–171.

Feldman JM, Lynch JG (1988) Self-generated validity and other effects of measurement on belief, attitude, intention, and behavior. J. Appl. Psych. 73(3):421–435.

Li X, Wu L (2013) Measuring effects of observational learning and social-network word-of-mouth (WOM) on the sales of daily–deal vouchers. Proc. 46th Hawaii Internat. Conf. System Sci. (HICSS), Maui, HI, 2908–2917.

Lin N, Cook KS, Burt RS (2001) Social Capital: Theory and Research (Transaction Publishers, New Brunswick, NJ).

Sun M (2012) How does the variance of product ratings matter? Management Sci. 58(4):696–707.

How direct-to-consumer brands are revolutionizing the consumer-packaged goods (CPG) industry


From Amazon to Apple, technology has disrupted traditional commerce companies, where technology solutions have enhanced the experience of the product or services for consumers. However, certain industries, such as consumer packaged goods (CPG), have remained relatively stable. In the past, innovation in CPG has been focused on products’ functionalities (e.g., a fast-action dish soap, or advanced whitening toothpaste). Despite CPG’s brand legacy and R&D capabilities, younger consumers are increasingly drawn to emerging micro-brands, small-scale brands tailored to niche markets (The Economist, 2018). In the rise of consumer-technology solutions, how do CPG companies stay relevant in delivering consumer-centric solutions? The answer lies with direct-to-consumer (DTC) brands. 

Overwhelmed with options in your local supermarket

What is a direct-to-consumer distribution?

Direct-to-consumer is the practice of selling to consumers directly, without the need of a third-party retailer or middleman. Adopting a DTC model has numerous benefits, including reducing costs associated with working with a middleman and furthering a company’s brand equity, where companies can further develop their brand relationship with customers on an e-commerce website or brick-and-mortar store. 

Direct sales also allow for a better understanding of customer data (Chonsksi, Caldbeck, and Jordan, 2019). When selling to a third-party store, consumer brands know how much volume they are selling to a store, but they do not know how well a certain product is selling in terms of individual sales. Thus, DTC sales enable greater understanding of sales data and valuable insight for marketing purposes.

An example of a successful DTC company is Warby Parker, the online retailer of prescription glasses and sunglasses. Founded in 2010, the company emerged as an online-only model, where customers received different styles of glasses in the mail to try at home, and purchase the style that best fits them (O’Connell, 2012). Priced at $95 per frame, the glasses were substantially more affordable than glasses in stores. Furthermore, the company established a donation program, where for each pair of glasses purchased, a pair is donated in partnership with the nonprofit, VisionSpring. Thus, consumers associate Warby Parker with affordable styles and social consciousness, messages of the brand that may not be conveyed through a third-party retailer. Warby Parker has also grown its presence to stores across the United States, extending the brand experience.

Warby Parker home delivery

How traditional CPG companies can innovate

While many retailers are adopting a DTC model, it is difficult to see this model applied with CPG brands because they are stapled goods. Household products have become part of ones’ routine, so there is little room for large-scaled innovation as such changes may not be accepted by consumers. At the same time, new “startup consumer brands” are emerging with an emphasis on an online-store or subscription model (Duguay, 2018). 

The shift to e-commerce reflects changing consumer behaviors, where consumers are increasingly attached to their computers and mobile devices. With the rise of grocery delivery services, it is evident that consumers find grocery shopping a hassle. As a result, these emerging consumer brands complement the shift in consumer purchasing habits. 

CPG companies can learn from this model by expanding their marketing channels and service delivery methods. While CPG brands have a presence on television and digital media, many consumers discover products and deals through their local supermarket. As a result, the supermarket plays an integral role in consumers’ perceptions of the brand. A DTC model would give CPG companies greater control of customers’ interaction with the brand. One way to accomplish this is through pop-up stores. For example, St. Ives, the skincare brand under Unilever, launched a pop-up store in New York City, where customers can purchase products and mix customized scents. Similarly, Kellogg’s, the iconic American cereal brand that has stocked grocery stores for a century, has opened a café in New York, where patrons can have a bowl of cereal with toppings. Both examples prove that traditional brands with a long legacy can continue to innovate by directly reaching the customers. 

From cereal box to cafe

CPG brands are also partnering with emerging brands to expand their portfolio capabilities. In 2016, Unilever purchased Dollar Shave Club for $1 billion (Cao & Mittleman, 2016). Although Unilever has an existing portfolio of shaving products, the company was interested in Dollar Shave Club’s subscription model and its capability of developing a strong following quickly. Similarly, Colgate acquired a minority stake in Hubble, an online subscription company for contact lenses, in 2018 (Copeland & Terlep, 2018). With Hubble, Colgate is exploring innovative ways to deliver its legacy products (think a subscription model for toothpaste). With Amazon and Walmart expanding their footprint and capabilities, traditional CPG companies are looking for innovative solutions to remain relevant. 

A $1billion acquisition

Implications for other industries

Aside from CPG companies, it would be interesting to see whether a DTC model applies to other traditional industries such as household appliances and electronics. Unlike CPG brands, there is not a high turnover for the product. You will not go through a washing machine as you would go through laundry detergent. Household appliances and electronics innovate with new functionalities are advancements in their existing technology (think a faster food processor). The challenge is that the average customers are not enticed to purchase the newest model of an appliance item because they are satisfied with a product that serves its fundamental purpose. As a result, household products are not agile to customer needs.            

However, a DTC model can still be applied in this industry. Purchasing appliances is still an experience, and many consumers want to see the product before purchasing it. Similar to Warby Parker, household appliance brands can have dedicated retail stores to showcase their line of the product instead of going through a third-party retailer (e.g., department stores). Another benefit of having dedicated stores is that customers can ask specialists questions about the product. Household appliances can also consider an e-commerce model, where users can test a product at home before committing to purchase the product. The limitation of this proposal is the cost of shipping and greater risks associated with larger products.

Looking Ahead

DTC distribution has proven to be successful, especially for emerging brands that have gained a loyal following. By selling products directly to the consumer, brands can control the messaging of the product. When it comes to CPG brands, there is are a lot of avenues for further growth including launching pop-up stores or partnering with emerging brands. Ultimately, a better understanding of the customer will position CPG companies for greater growth. 

References

Cao, J. (2016, July 21). Why Unilever Really Bought Dollar Shave Club. Retrieved March 8, 2019, from https://www.bloombergquint.com/business/why-unilever-really-bought-dollar-shave-club#gs.0ippbt

Chokshi, S., Caldbeck, R., & Jordan, J. (2019, February 25). A16z Podcast: Who’s Down with CPG, DTC? (And Micro-Brands Too?). Retrieved March 8, 2019, from https://a16z.com/2019/02/15/cpg-dtc-microbrands-grocery-online-offline-commerce/

Copeland, R., & Terlep, S. (2018, July 02). A Toothpaste Club? Colgate to Invest in Online Startup. Retrieved March 8, 2019, from https://www.wsj.com/articles/a-toothpaste-club-colgate-to-invest-in-online-startup-1530537593

Duguay, A. (2018, March 15). If The Consumer Is Strong, Why Are CPG Brands Struggling? Retrieved March 8, 2019, from https://www.forbes.com/sites/forbesfinancecouncil/2018/03/15/if-the-consumer-is-strong-why-are-cpg-brands-struggling/#3bfb3fcb4728

O’Connell, V. (2012, July 19). Warby Parker Co-Founder Says Initial Vision Was All About Price. Retrieved March 8, 2019, from https://www.wsj.com/articles/SB10000872396390444097904577535111565440718

The growth of microbrands threatens consumer-goods giants. (2018, November 08). Retrieved March 8, 2019, from https://www.economist.com/business/2018/11/08/the-growth-of-microbrands-threatens-consumer-goods-giants

How Unbecoming of You: Gender Biases in Perceptions of Ridesharing Performance


RSM MSc BIM CCDC – Group 11

This blog post aims to provide a review of the research paper “How Unbecoming of You: Gender Biases in Perceptions of Ridesharing Performance” published by the researchers Greenwood, Adjerid, and Angst in 2018. The post concludes with a business case of Uber, which relates closely to the paper’s topic of the perceived gender biases in ridesharing performance.

Paper Review

The main objective of this research is to unravel significant biases that exist when consumers place a review online. More specifically, the researchers decided to focus on the gender biases that might take place on ridesharing platforms. While aspects of the rating process have a role to play, the characteristics of the rater and ratee have been found to have an effect on the willingness to transact. That is, the ex-ante evaluation of quality, meaning how an individual assesses a product or service before actually consuming it. These ex-ante quality perceptions were examined against the post transaction perceptions of quality. A few papers have previously addressed gender as a possible factor that can affect service quality evaluation. However, this paper delivers novel and valuable insights by taking into consideration gender as a plausible factor that could affect user post-consumption evaluation.

The researchers measured the perception of quality both before and after the service and developed three hypotheses to test, namely;

  • (H1) “Female gender status will correlate with lower ex ante perceived quality of service, as compared with men, all else equal.”
  • (H2) “Female drivers will be penalized to a greater degree, as compared with male drivers, for performance shortfalls, all else equal.”
  • (H3) “Female drivers will be penalized to a greater degree, as compared with male drivers, for performance shortfalls when performing highly gendered tasks, all else equal.”

To test the hypotheses, the paper uses an experiment with a 2 (gender) x 2 (race) x 2 (Historical Quality) x 2 (Experience Quality), between-subjects research design. The researchers informed the participants that they represented a new ride sharing service, called Agile Rides. Agile Rides was in the process of being launched and participants’ assistance was required to understand what makes a good rider experience, bringing the experiment closer to a real world setting.

One of the main findings of the paper was that with historic quality being available, gender bias does not penalize women drivers before the service is rendered in a ridesharing context (H1). However, if the service provided by a woman is of a lower quality, worse ratings accrue for females relative to males with the similar performance (H2). Furthermore, when the tasks were considered highly gendered (either feminine or masculine), these penalties were intensified when performed by female drivers than by male drivers with the same performance (H3).

Strenghts & Weaknesses

Although there is no question regarding the relevancy of the paper, multiple strengths and weaknesses do exist. First, one strength of the paper is that gender and quality manipulations are extensively tested in the pre-studies. This allows the researchers to make accurate comparisons of perceived quality before and after the experiment has taken place. Second, the paper delivers high practical implications for services that work with online rating systems. These services can now identify which steps they must take in order to limit how gender bias is affecting the perceived quality of services offered.

However, one weakness of the paper is that the researchers did not account for previous ride sharing experiences of participants. These experiences, either positively or negatively, could have influenced their quality perceptions. One suggestion would be that the researchers should inquire about the respondents’ previous ride sharing experiences. By doing so, the researchers could examine and compare the responses of the respondents with positive, negative, or no previous ride sharing experiences, in order to find out if pre-ride sharing experiences could yield different results. Second, participants were asked to imagine a hypothetical situation, which creates the risk that riders’ behaviour in real life could differ from what they have indicated. According to Ajzen et al. (2004), bias in hypothetical situations exist because individuals imagine that they will act according to social norms and expectations, which is not always the case in real life. The results in a real world setting could therefore differ from the results found in the research. A possible solution to this problem is to implement Virtual Reality (VR) when measuring the quality perceptions of the participants. Instead of only relying on text to imagine a situation, participants can now also experience it with visuals. Situations closer to real life settings can be created and bias can be reduced.

Business Case Uber

An example of a company that outsources driver ratings and has experienced gender bias in their evaluation system is Uber.

Generally, after a ride, a passenger is asked, through an Uber app, to rate the driver anonymously using “1- to 5-star scale” (Rosenblat et al., 2016, p. 3). Leveraging anonymous consumer-sourced ratings, Uber outsources driver evaluation to consumers. Nevertheless, as consumers enter their ratings into the system, algorithms also record the consumers’ implicit biases. A case study on Uber reveals that driver ratings are highly likely to be biased by factors such as race, ethnicity and gender (Rosenblat et al., 2016). In the world, there are laws that protects consumers from direct discrimination such as The Equality Act 2010. However, there is currently no law that handles indirect bias like those generated from consumer-sourced ratings. As such, the authors of the Uber case study propose following ten interventions to limit bias in the consumer-sourced ratings (Rosenblat et al., 2016).

  • First, it is important to track consumer-sourced ratings which enables identification of potential driver bias patterns.
  • Second, it is equally important to disclose the identified patterns to the public in order to propel solutions within Uber. 
  • Third, ratings should be validated in conjunction with behavioural data. For example, if a driver receives a low rating, the speed with which the driver drove should also be assessed in order to justify the low performance.
  • Fourth, each rating should have a different weight to account for potential biased raters, which are found upon statistics. 
  • Fifth, Uber should increase feedback criteria for consumers who provide low ratings, for example elaboration on certain dimensions they were dissatisfied with. 
  • Sixth way to eliminate consumer-sourced biases is to keep the consumer-sourced ratings only for internal uses rather than driver evaluation. 
  • Seventh, Uber can also increase in-person assessments of low-rated drivers. 
  • Eight suggestion is about opening the platform fully to both drivers and consumers. With an open policy, both parties would be able to join the platform, get to know each other and receive the option to select or approve upon each other requests.

The last two interventions prompt to alter the legal aspect of ride-sharing platforms: 

  • Ninth plausible solution could be to turn self-employed drivers into law-protected employees.  
  • Finally, the authors suggest legal bodies to “lower the pleading requirements for claims” that are brought against ride-sharing platforms (Rosenblat et al., 2016, p. 16).

In conclusion, the paper presents novel findings that serve to inform ridesharing platforms, such as Uber, about biases in their evaluation services. Furthermore, this blog post provides ridesharing platforms with ten interventions to limit possible biases in their consumer-sourced ratings.

References

Ajzen, I., Brown, T. C., and Carvajal, F. 2004. “Explaining the Discrepancy Between Intentions and Actions: The case of hypothetical bias in contingent valuation,” Personality and Social Psychology Bulletin (30:9), pp. 1108-1121.

Greenwood, B. N., Adjerid, I., & Angst, C. M. (2017). How Unbecoming of You: Gender Biases in Perceptions of Ridesharing Performance.

Competing for Attention: An Empirical Study of Online Reviewers’ Strategic Behavior


This is a review of the paper “Competing for Attention: An Empirical Study of Online Reviewers’ Strategic Behavior’ written by Shen, Hu & Ulmer (2015).

Introduction
In 2007, a study by Deloitte found that 62% of consumers read consumer-written online product reviews, and among these consumers, 82% stated that their purchase decisions were directly influenced by online reviews. Shen, Hu & Ulmer (2015) argue that these percentages would be higher if the study were to be replicated today, as consumers increasingly rely on online opinions and experiences shared by consumers when deciding what product to purchase. As such, it is important for companies to understand what incentivizes online reviewers to actually write reviews and what the effects of incentives are on the content of their reviews (Shen et al., 2015).

The authors argue that there is a large body of literature on online product reviews, but that this existing body of literature has failed to look at how online reviewers are incentivized to write reviews (Shen et al., 2015). This includes studies such as by Basuroy et al. (2003), who looked at numerical aspects of reviews and studies such as by Godes & Silva (2012), who looked at the evolution of review ratings. However, the authors note that a large part of existing research simply assumes that reviews are written for the same motives that offline consumers have when they provide word-of-mouth reviews (Dichter, 1966).

With this gap in mind, the authors drew from literature in other contexts, such as motivation for voluntary contributions in open source software and firm-hosted online forums. Building on this literature, the authors propose that gaining online reputation and attention from other consumers is an important motivation for their contribution to review systems (Shen et al., 2015). In order to explore this, the paper “empirically investigates how incentives such as reputation and attention affect online reviewers’ behaviours” (Shen et al., 2015, p. 684).

The Methodology
In order to conduct this empirical investigation, the authors use real-life data of online reviews of books and electronics, gathered from Amazon and Barnes & Noble (Shen et al., 2015). The data was collected on a daily basis and allows for a comparison both across product categories as well as across different review systems (Shen et al., 2015). Amazon and Barnes & Noble were selected because they are the two largest online book retailers and have two distinctly different review environments (Shen et al., 2015). Whereas Amazon ranks reviewers based on their contribution, allowing the reviewers to build up a reputation and consistently gain future attention, Barnes & Noble does not offer any of this (Shen et al., 2015).

The authors gathered a sample that includes all books released between September and October 2010, resulting in a sample of 1,751 books with 10,195 reviews (Shen et al., 2015, p. 685). Additionally, the authors randomly selected 500 electronic products on Amazon in order to allow for cross category comparison with the findings resulting from the analysis of the book reviews, allowing the authors to generalize their findings (Shen et al., 2015).

Based on this data, the authors look at two review mechanisms at two levels, namely the product level and the review rating level.

At the product level, the authors study how popularity (determined by the sales volume of the product) and crowdedness (measured by the number of preexisting reviews for the product) affect a reviewer’s decision on whether to write a review for a product (Shen et al., 2015). Additionally, the model controls for potential reviewers (in order to control for the possibility that an increasing number of daily reviews is due to an increasing number of potential reviewers over time) and the effect of time, in order to control for the issue that reviewers might lose interesting in writing reviews for products that have been out for a while (Shen et al., 2015). The resulting model for the product level can be found below:

https://lh3.googleusercontent.com/wUcjn8yBi79VRix7izp_Li-WSi09cca26nWw4Sx02Vopa8UlFegJ1vpLX9VsGaOBhvnq-tol3oByuZa-EercwfQ_aLaNsplYBvOhUWLfgNG-BgloPMyaBSQ-vuRME-waI37QirgGyr4

At the review rating level, the authors study how reputation status affects reviewer’s decisions on whether to differentiate from the current consensus (Shen et al., 2015). They look at how a target rating deviates from the average rating, indicating how differentiated the rating is (Shen et al., 2015).

Main Results
The main results stemming from this study are that online reviewers appear to behave differently when they have strong incentives to gain attention and enhance their online reputation (Shen et al., 2015). Looking at popularity, online reviewers tend to select popular books to review, as this would allow them to receive more attention (Shen et al., 2015). As for the crowdedness, it was found that fewer reviewers will choose to review a book if the review segment becomes crowded, indicating that reviewers tend to avoid such spaces as they would have to compete for attention (Shen et al., 2015).

Next to this, differences in the results between Amazon and Barnes & Noble indicate that in online review environments with a reviewer ranking system, reviewers are more strategic and post more differentiated ratings to capture attention, doing so to improve their online reputation (Shen et al., 2015). In turn, this reviewer ranking system intensifies the competition for attention among reviewers. Next to these main findings, the authors ran some additional analyses to further understand online reviewers behaviours (Shen et al., 2015).

Running the same analyses on the electronic products dataset yielded consistent results. As such, the authors argue that their findings are robust (Shen et al., 2015).

Adding onto their results, the authors argue that with a reviewer ranking system through which reviewers can build up their reputation, opportunities arise for reviewers to monetize their online reputation by receiving free products, travel invitations and even job offers (Coster, 2006).

Strength & Managerial Implications
The main strength of this paper is in its use of real-life cases and the practical implications for online review systems and companies that make use of these review systems.

As reviewers respond strategically to incentives such as a quantified online reputation, this can be used to motivate reviewers consistently (Shen et al., 2015). An example of this is TripAdvisor’s profiles and contributor badges (as seen in the picture to the left).

Additionally, as reviewers are more likely to write a review for popular but uncrowded products, companies can make use of this by sending review invitations to niche product buyers and emphasize the small number of existing reviews or even by highlighting small numbers of existing reviews in the design of the website (Shen et al., 2015).  As companies have their own specific goals, they may develop their own algorithms for selecting certain groups of reviewers to receive review invitations, rather than sending these invitations to every buyer, as is currently the common practice (Shen et al., 2015).

Lastly, reviewers that consistently offer highly differentiated reviews should carefully be taken into account by companies as these reviewers might simply be trying to game the system rather than serve the purpose of the review of signaling product quality (Shen et al., 2015). This can be through the use of ranks, but also other signals, such as “helpfulness” votes or even altered algorithms for such reviewers.

References

Basuroy, S., Chatterjee, S., & Ravid, S. A. (2003). How critical are critical reviews? The box office effects of film critics, star power, and budgets. Journal of marketing67(4), 103-117.

Coster, H. (2006). The Secret Life of An Online Book Reviewer. Forbes, December1.

Deloitte. (2007). “Most Consumers Read and Rely on Online Reviews; Companies Must Adjust,” Deloitte & Touche USA LLP.

Godes, D., & Silva, J. C. (2012). Sequential and temporal dynamics of online opinion. Marketing Science31(3), 448-473.

Shen, W., Hu, Y. J., & Ulmer, J. R. (2015). Competing for Attention: An Empirical Study of Online Reviewers’ Strategic Behavior. Mis Quarterly39(3), 683-696.

Group 10.

Republic – Promoting Early Stage Investment Accessibility With Equity Based Crowdfunding


Why Crowdfunding?

Being an entrepreneur is not an easy task, and raising capital for your project can be particularly difficult. According to Younkin and Kuppuswamy (2016), a significant hurdle to launching your world changing idea is access to seed capital or early-stage funding. Many will find it quite difficult to raise funds from traditional channels, such as banks and angel investors. The solution? More and more individuals have turned towards crowdfunding platforms for early-stage capital. And it seems the industry is growing stronger than ever before with an annual growth rate of 17% (Business Wire, 2018). In 2016, transactions on reward-based crowdfunding platforms alone were valued at three billion USD and is expected to hit 8.4 billion USD in 2020 (Statista, n.d.).

It should be noted that there are 4 types of crowdfunding (Nibusinessinfo, n.d.):

  • Reward crowdfunding; involves the return of non-financial benefits
  • Debt crowdfunding; involves receiving financial interest on one’s investment
  • Equity crowdfunding; involves receiving shares
  • Donation crowdfunding; involves donating to a project

While equity-based crowdfunding presents a far more accessible alternative for entrepreneurs compared to angel investors or venture capital funds, the same cannot be said for regular investors. As equity-based crowdfunding involves the distribution of securities, it is subject to many regulatory constraints which prevent most individuals from investing on these platforms. Fortunately, in May 2016, the U.S. Securities and Exchange Commission (SEC) enforced Title III of the JOBS Act, which essentially permitted the 97% of US residents to invest in startups (Republic, n.d.). However, the convoluting legal requirements are not approachable to most founders and new investors.

Source: Republic.co/about

About Republic

So what is Republic? According to its website, Republic (n.d.) is an equity-based and SEC licensed crowdfunding platform that aims “to democratise investing and level out the fundraising landscape for founders and investors alike”. It was founded in 2016 shortly after the JOBS Act was enacted. Furthermore, it is part of a group of startup platforms, which includes two household names from the online startup ecosystem: AngelList and Product Hunt. In fact, the former played an essential role in legislating the JOBS Act and several Republic founders are its alumni.

One of the platform’s main objective is to facilitate accessibility to early-stage investment for ordinary folks such as you and me. However, Republic also focuses on another vital issue in the startup community that I have not yet mentioned: minority founder discrimination. According to Younkin and Kuppuswamy (2016), there’s an underrepresentation of minorities among funded ventures. The researchers initially explain this observation with biases towards minority founders from resource providers. By examining thousands of Kickstarter projects and carrying out several experimental tests, they eventually discover that unconscious bias is the main form discrimination driving this outcome.

It is particularly important to mention that while crowdfunding does not eliminate discrimination towards minority founders, the platform does indeed allow for means to address this issue. Republic (n.d.) has recognised this potential and are consequently using their crowdfunding platform to promote minority founders. However, they are not only focusing on minorities, but on other marginalised groups in the startup world. For instance, this includes women, veterans, the LGBT community and immigrants as well.

Their Success

So how exactly does Republic promote these marginalised groups on their platform? As you can see in Image 1 below, projects may be labelled with tags, informing investors about the nature of the project as well as the type of founders running it, ranging from “Minority Founders” and “Immigrant Founders” to “Female Founders”. Similarly, investors can filter through projects based on these tags. However, apart from these features, you won’t encounter any particular differences compared to alternative crowdfunding platforms.

Image 1: Overview of two projects on Republic

Given these simple measure and the platform’s overt support for marginalised founders, one might nonetheless be skeptical about the effectiveness of their actions. However, a report by Republic (2018) revealed otherwise. Image 2 and 3 below illustrates some of their achievements. For instance, 25% of all investments on the Republic platform have gone towards companies with founders of colour, which is far above the national average for traditional VCs. Similarly, the same can be observed for women where 44% of funded projects on Republic included female founders as compared to 13% with traditional VCs.

Image 2. Republic Success Overview With Founders. Source: https://republic.co/blog/the-business-of-diversity

However, they not only managed to close these gaps of underrepresentation for founders, but for investors alike. As they allow anyone to invest with as little as 10$ on their platform, Republic managed to gather funds for projects from women 30% of the time. This is a significant improvement compared to regular VC firms and even Angel Investors (Republic, 2018).

Image 3. Republic Success Overview With Investors. Source: https://republic.co/blog/the-business-of-diversity

It might not come as a surprise to you that such a success has attracted a lot of attention from startups. Nonetheless, according to Christopher (2018), companies need to go through a thorough vetting process to comply with US regulations that aim to protect these newfound investors. Out of 3000 companies that had applied to the platform by October 2018, only a handful managed to get onto the platform. However, once on it, founders are able to enjoy a slew of benefits, such as ongoing support, advice and mentorship, including access to Republic’s extensive network of traditional VC.

The Future Ahead

However, according to Greenberg (2018), there is still much room for improvement. At the time of this writing, current US regulations limit crowdfunding to $1 million. More often than not, this is not sufficient to entirely fund a startup. As a result, founders are required to raise money from several other sources, not only from Republic. Consequently, this may pose a problem to marginalised founders who will undoubtedly re-encounter the same problems they tried to avoid in the first place. Caroline Hofmann, the COO of Republic, mentions that if this limit could be raised to 5$ million, crowdfunding platforms such as Republic could potentially act as a sole source of funding, thus allowing founders to completely pivot away from traditional fundraising institutions.

References

Business Wire (2018). Global Crowdfunding Market 2018-2022 | Social Media as a Source of Cost-free Promotion to Boost Demand | Technavio. Retrieved from: https://www.businesswire.com/news/home/20181203005889/en/Global-Crowdfunding-Market-2018-2022-Social-Media-Source

Christopher, E. (2018). Survey Shows Founders Ignored by VCs Are Succeeding With Equity Crowdfunding. Entrepreneur Europe. Retrieved from: https://www.entrepreneur.com/article/321438

Greenberg, A. (2018). Equity Crowdfunding Is Changing The Landscape For Underrepresented Founders. Forbes. Retrieved from: https://www.forbes.com/sites/amandagreenberg/2018/05/18/equity-crowdfunding-is-changing-the-funding-landscape-for-underrepresented-founders/#e4428b77fbaf

Nibusinessinfo (n.d.). Crowdfunding: Types of Crowdfunding. Retrieved from: https://www.nibusinessinfo.co.uk/content/types-crowdfunding

Republic (n.d.). About. Retrieved from: https://republic.co/about

Republic (2018). Republic Report – The business of diversity. Retrieved from: https://republic.co/blog/the-business-of-diversity

Statista (n.d.). Crowdfunding. Retrieved from: https://www.statista.com/outlook/335/100/crowdfunding/worldwide#market-revenue

Younkin, P., & Kuppuswamy, V. (2016). Is the Crowd Colorblind? Founder race and performance in crowdfunding. Academy of Management Proceedings, 2016(1), 11665. doi:10.5465/ambpp.2016.11665abstract